

Population Dynamics of Benthic Species and Shorebird Predation
325
Table 15.2. Average instantaneous death rate (a-I) ± among-years SD.
Geometric-mean survival percentage (per half-year period) is given in
parentheses
First winter
Later winters
Later summers
n
25
25
26
Macoma balthica
1.23 ±OA06 (29 %)
O.146±O.122 (86 %)
O.348±O.161 (71 %)
Cerastoderma edule
1.51 ±O.937 (22 %)
1.29 ±1.24 (27 %)
0.597±O.721 (55 %)
first-winter survival of M. balthica may be biased, because the assumption of
no net migration cannot be reliably made for this period.
Annual survival of M. balthica was larger and much more constant from
year-to-year than survival of C. edule. The instantaneous death rate for all
individuals older than one year, averaged over the years 1974-1998 (n=25),
was 0.50 a-I (SD 0.144; CI 0.45-0.54) for M. balthica, and 1.91 a-I (SD 1.39; CI
1.79-2.54) for C. edule. These averages are equivalent to geometric mean
survival percentages.of 61 and 15 %, respectively. For older M. balthica winter
survival was higher than summer survival, but summer survival was higher
than winter survival for C. edule (Table 15.2). For individuals older than
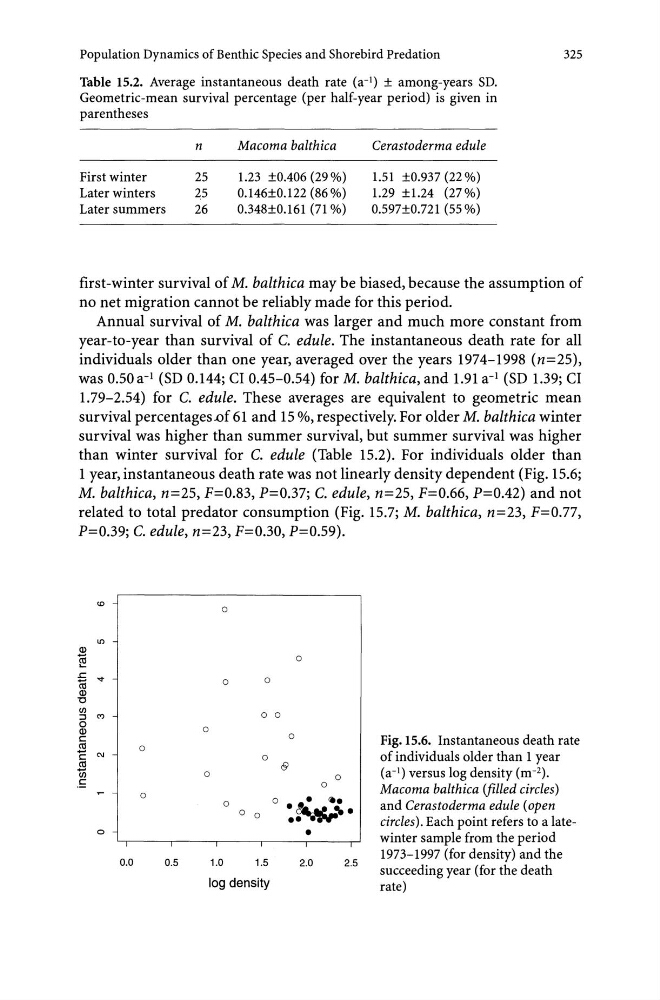
1 year, instantaneous death rate was not linearly density dependent (Fig. 15.6;
M. balthica, n=25, F=0.83, P=0.37; C. edule, n=25, F=0.66, P=0.42) and not
related to total predator consumption (Fig. 15.7; M. balthica, n=23, F=0.77,
P=0.39; C. edule, n=23, F=0.30, P=0.59).
lJ)
CD
~
.r:: ""
0
til
0
CD
'0
CJl
o 0
:::l
'"
0
0
CD
C
$
0
C
N
0
C\l
U5
0
.!:
0
0
0
0 0
0
0.0
0.5
1.0
1.5
log density
0
0
@
0
0
. ,..
.~ ...
•• •
2.0
2.5
Fig.15.6. Instantaneous death rate
of individuals older than 1 year
(a-I) versus log density (m- 2 ).
Macoma balthica (filled circles)
and Cerastoderma edule (open
circles). Each point refers to a latewinter sample from the period
1973-1997 (for density) and the
succeeding year (for the death
rate)
325
Table 15.2. Average instantaneous death rate (a-I) ± among-years SD.
Geometric-mean survival percentage (per half-year period) is given in
parentheses
First winter
Later winters
Later summers
n
25
25
26
Macoma balthica
1.23 ±OA06 (29 %)
O.146±O.122 (86 %)
O.348±O.161 (71 %)
Cerastoderma edule
1.51 ±O.937 (22 %)
1.29 ±1.24 (27 %)
0.597±O.721 (55 %)
first-winter survival of M. balthica may be biased, because the assumption of
no net migration cannot be reliably made for this period.
Annual survival of M. balthica was larger and much more constant from
year-to-year than survival of C. edule. The instantaneous death rate for all
individuals older than one year, averaged over the years 1974-1998 (n=25),
was 0.50 a-I (SD 0.144; CI 0.45-0.54) for M. balthica, and 1.91 a-I (SD 1.39; CI
1.79-2.54) for C. edule. These averages are equivalent to geometric mean
survival percentages.of 61 and 15 %, respectively. For older M. balthica winter
survival was higher than summer survival, but summer survival was higher
than winter survival for C. edule (Table 15.2). For individuals older than
1 year, instantaneous death rate was not linearly density dependent (Fig. 15.6;
M. balthica, n=25, F=0.83, P=0.37; C. edule, n=25, F=0.66, P=0.42) and not
related to total predator consumption (Fig. 15.7; M. balthica, n=23, F=0.77,
P=0.39; C. edule, n=23, F=0.30, P=0.59).
lJ)
CD
~
.r:: ""
0
til
0
CD
'0
CJl
o 0
:::l
'"
0
0
CD
C
$
0
C
N
0
C\l
U5
0
.!:
0
0
0
0 0
0
0.0
0.5
1.0
1.5
log density
0
0
@
0
0
. ,..
.~ ...
•• •
2.0
2.5
Fig.15.6. Instantaneous death rate
of individuals older than 1 year
(a-I) versus log density (m- 2 ).
Macoma balthica (filled circles)
and Cerastoderma edule (open
circles). Each point refers to a latewinter sample from the period
1973-1997 (for density) and the
succeeding year (for the death
rate)