

324
c
0
a E ::::l C/)
C
0
(.)
o
C\I
~
~
'"
0
0
5
c:P
I2J
DO
10
15
production
0
20
J. van der Meer et al.
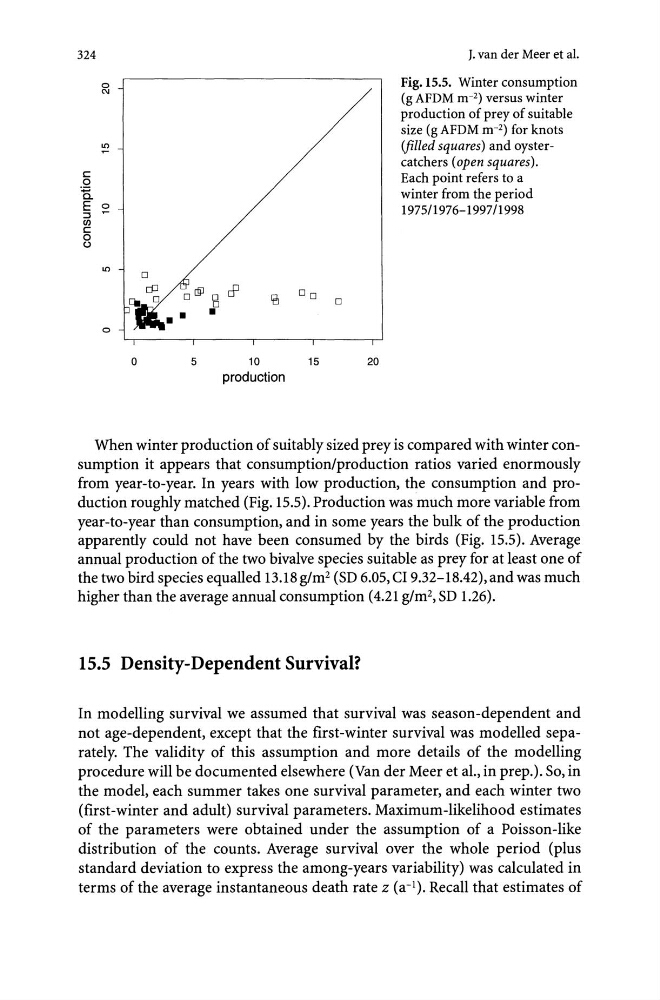
Fig. 15.5. Winter consumption
(g AFDM m- 2 ) versus winter
production of prey of suitable
size (g AFDM m- 2 ) for knots
(filled squares) and oystercatchers (open squares).
Each point refers to a
winter from the period
1975/1976-1997/1998
When winter production of suitably sized prey is compared with winter consumption it appears that consumption/production ratios varied enormously
from year-to-year. In years with low production, the consumption and production roughly matched (Fig. 15.5). Production was much more variable from
year-to-year than consumption, and in some years the bulk of the production
apparently could not have been consumed by the birds (Fig. 15.5). Average
annual production of the two bivalve species suitable as prey for at least one of
the two bird species equalled 13.18 g/m2 (SD 6.05, CI 9.32-18.42), and was much
higher than the average annual consumption (4.21 g/m2, SD 1.26).
15.5 Density-Dependent Survival?
In modelling survival we assumed that survival was season-dependent and
not age-dependent, except that the first-winter survival was modelled separately. The validity of this assumption and more details of the modelling
procedure will be documented elsewhere (Van der Meer et aI., in prep.). So, in
the model, each summer takes one survival parameter, and each winter two
(first-winter and adult) survival parameters. Maximum-likelihood estimates
of the parameters were obtained under the assumption of a Poisson-like
distribution of the counts. Average survival over the whole period (plus
standard deviation to express the among-years variability) was calculated in
terms of the average instantaneous death rate z (a-I). Recall that estimates of
c
0
a E ::::l C/)
C
0
(.)
o
C\I
~
~
'"
0
0
5
c:P
I2J
DO
10
15
production
0
20
J. van der Meer et al.
Fig. 15.5. Winter consumption
(g AFDM m- 2 ) versus winter
production of prey of suitable
size (g AFDM m- 2 ) for knots
(filled squares) and oystercatchers (open squares).
Each point refers to a
winter from the period
1975/1976-1997/1998
When winter production of suitably sized prey is compared with winter consumption it appears that consumption/production ratios varied enormously
from year-to-year. In years with low production, the consumption and production roughly matched (Fig. 15.5). Production was much more variable from
year-to-year than consumption, and in some years the bulk of the production
apparently could not have been consumed by the birds (Fig. 15.5). Average
annual production of the two bivalve species suitable as prey for at least one of
the two bird species equalled 13.18 g/m2 (SD 6.05, CI 9.32-18.42), and was much
higher than the average annual consumption (4.21 g/m2, SD 1.26).
15.5 Density-Dependent Survival?
In modelling survival we assumed that survival was season-dependent and
not age-dependent, except that the first-winter survival was modelled separately. The validity of this assumption and more details of the modelling
procedure will be documented elsewhere (Van der Meer et aI., in prep.). So, in
the model, each summer takes one survival parameter, and each winter two
(first-winter and adult) survival parameters. Maximum-likelihood estimates
of the parameters were obtained under the assumption of a Poisson-like
distribution of the counts. Average survival over the whole period (plus
standard deviation to express the among-years variability) was calculated in
terms of the average instantaneous death rate z (a-I). Recall that estimates of