

72
o
200
E 400
"
!600
tIOO
1~~ ________________ ~~ __ ~ '===:==~~
.28.5
lOS
3000
~~--'------r----~----~----~r-----~
65
70
75
ulltude
80
85
90
C. Schafer-Neth . K. Stattegger
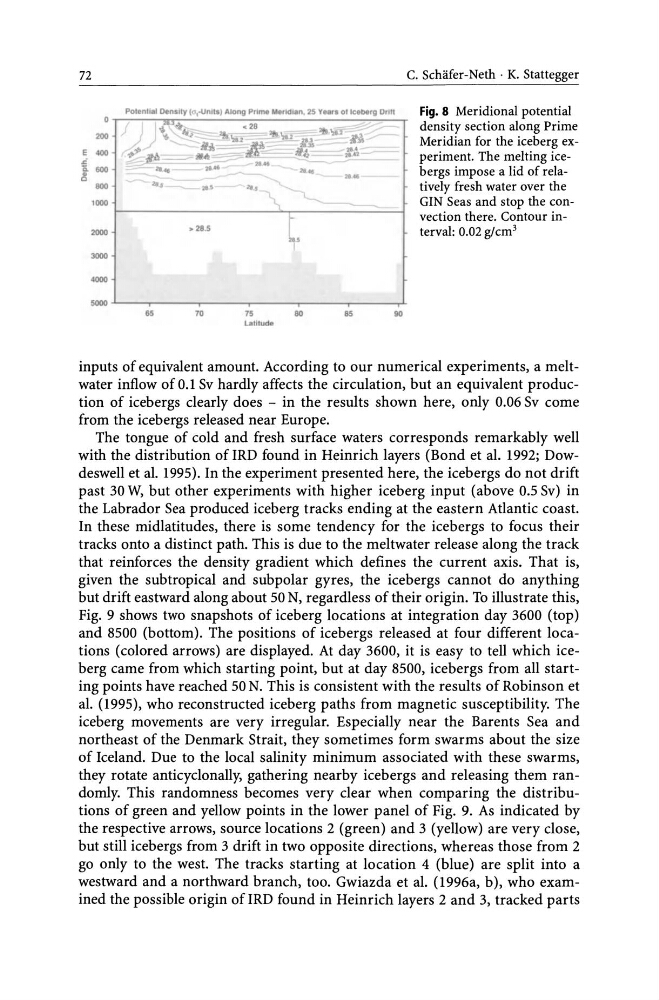
Fig. 8 Meridional potential
density section along Prime
Meridian for the iceberg experiment. The melting icebergs impose a lid of relatively fresh water over the
GIN Seas and stop the convection there. Contour interval: 0.02 g/cm 3
inputs of equivalent amount. According to our numerical experiments, a meltwater inflow of 0.1 Sv hardly affects the circulation, but an equivalent production of icebergs clearly does - in the results shown here, only 0.06 Sv come
from the icebergs released near Europe.
The tongue of cold and fresh surface waters corresponds remarkably well
with the distribution of IRD found in Heinrich layers (Bond et al. 1992; Dowdeswell et al. 1995). In the experiment presented here, the icebergs do not drift
past 30 W, but other experiments with higher iceberg input (above 0.5 Sv) in
the Labrador Sea produced iceberg tracks ending at the eastern Atlantic coast.
In these midlatitudes, there is some tendency for the icebergs to focus their
tracks onto a distinct path. This is due to the meltwater release along the track
that reinforces the density gradient which defines the current axis. That is,
given the subtropical and subpolar gyres, the icebergs cannot do anything
but drift eastward along about 50 N, regardless of their origin. To illustrate this,
Fig. 9 shows two snapshots of iceberg locations at integration day 3600 (top)
and 8500 (bottom). The positions of icebergs released at four different locations (colored arrows) are displayed. At day 3600, it is easy to tell which iceberg came from which starting point, but at day 8500, icebergs from all starting points have reached 50 N. This is consistent with the results of Robinson et
al. (1995), who reconstructed iceberg paths from magnetic susceptibility. The
iceberg movements are very irregular. Especially near the Barents Sea and
northeast of the Denmark Strait, they sometimes form swarms about the size
of Iceland. Due to the local salinity minimum associated with these swarms,
they rotate anticyclonally, gathering nearby icebergs and releasing them randomly. This randomness becomes very clear when comparing the distributions of green and yellow points in the lower panel of Fig. 9. As indicated by
the respective arrows, source locations 2 (green) and 3 (yellow) are very close,
but still icebergs from 3 drift in two opposite directions, whereas those from 2
go only to the west. The tracks starting at location 4 (blue) are split into a
westward and a northward branch, too. Gwiazda et al. (1996a, b), who examined the possible origin of IRD found in Heinrich layers 2 and 3, tracked parts
o
200
E 400
"
!600
tIOO
1~~ ________________ ~~ __ ~ '===:==~~
.28.5
lOS
3000
~~--'------r----~----~----~r-----~
65
70
75
ulltude
80
85
90
C. Schafer-Neth . K. Stattegger
Fig. 8 Meridional potential
density section along Prime
Meridian for the iceberg experiment. The melting icebergs impose a lid of relatively fresh water over the
GIN Seas and stop the convection there. Contour interval: 0.02 g/cm 3
inputs of equivalent amount. According to our numerical experiments, a meltwater inflow of 0.1 Sv hardly affects the circulation, but an equivalent production of icebergs clearly does - in the results shown here, only 0.06 Sv come
from the icebergs released near Europe.
The tongue of cold and fresh surface waters corresponds remarkably well
with the distribution of IRD found in Heinrich layers (Bond et al. 1992; Dowdeswell et al. 1995). In the experiment presented here, the icebergs do not drift
past 30 W, but other experiments with higher iceberg input (above 0.5 Sv) in
the Labrador Sea produced iceberg tracks ending at the eastern Atlantic coast.
In these midlatitudes, there is some tendency for the icebergs to focus their
tracks onto a distinct path. This is due to the meltwater release along the track
that reinforces the density gradient which defines the current axis. That is,
given the subtropical and subpolar gyres, the icebergs cannot do anything
but drift eastward along about 50 N, regardless of their origin. To illustrate this,
Fig. 9 shows two snapshots of iceberg locations at integration day 3600 (top)
and 8500 (bottom). The positions of icebergs released at four different locations (colored arrows) are displayed. At day 3600, it is easy to tell which iceberg came from which starting point, but at day 8500, icebergs from all starting points have reached 50 N. This is consistent with the results of Robinson et
al. (1995), who reconstructed iceberg paths from magnetic susceptibility. The
iceberg movements are very irregular. Especially near the Barents Sea and
northeast of the Denmark Strait, they sometimes form swarms about the size
of Iceland. Due to the local salinity minimum associated with these swarms,
they rotate anticyclonally, gathering nearby icebergs and releasing them randomly. This randomness becomes very clear when comparing the distributions of green and yellow points in the lower panel of Fig. 9. As indicated by
the respective arrows, source locations 2 (green) and 3 (yellow) are very close,
but still icebergs from 3 drift in two opposite directions, whereas those from 2
go only to the west. The tracks starting at location 4 (blue) are split into a
westward and a northward branch, too. Gwiazda et al. (1996a, b), who examined the possible origin of IRD found in Heinrich layers 2 and 3, tracked parts