

54
7 5 t 5
8
standard deviation factor
of depth averaged
SPM concentration
computed date
W. PuIs· T. Pohlmann· J. Siindermann
o 1- 1.6
1.6 - 2
2 - 2.6
_
> 2.6
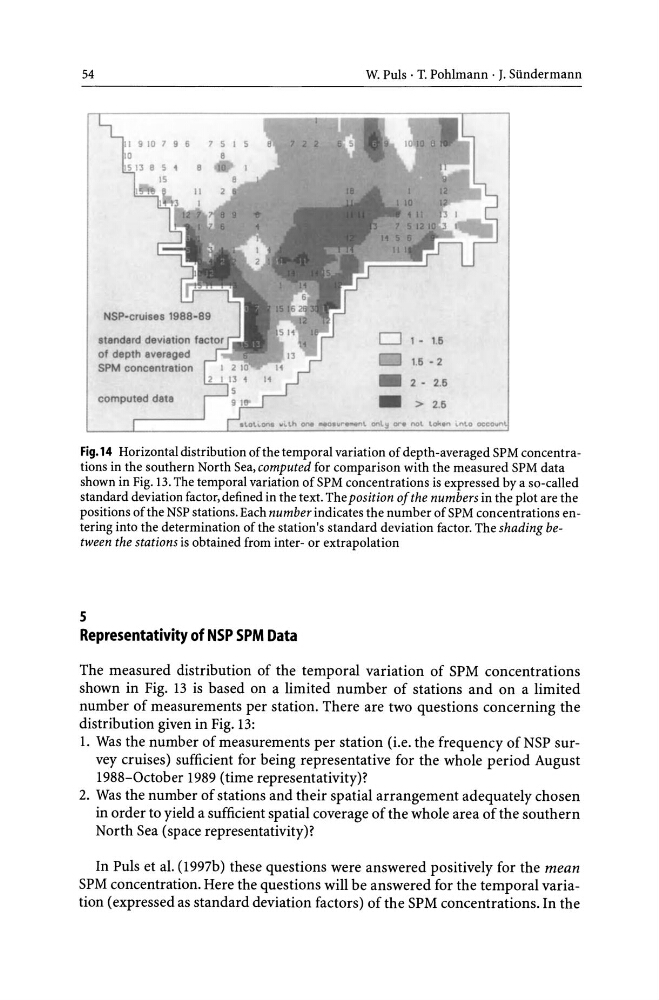
Fig.14 Horizontal distribution of the temporal variation of depth-averaged SPM concentrations in the southern North Sea, computed for comparison with the measured SPM data
shown in Fig. 13. The temporal variation of SPM concentrations is expressed by a so-called
standard deviation factor, defined in the text. The position of the numbers in the plot are the
positions of the NSP stations. Each number indicates the number of SPM concentrations entering into the determination of the station's standard deviation factor. The shading between the stations is obtained from inter- or extrapolation
5
Representativity of NSP SPM Data
The measured distribution of the temporal variation of SPM concentrations
shown in Fig. 13 is based on a limited number of stations and on a limited
number of measurements per station. There are two questions concerning the
distribution given in Fig. l3:
1. Was the number of measurements per station (i.e. the frequency of NSP survey cruises) sufficient for being representative for the whole period August
1988-0ctober 1989 (time representativity)?
2. Was the number of stations and their spatial arrangement adequately chosen
in order to yield a sufficient spatial coverage of the whole area of the southern
North Sea (space representativity)?
In PuIs et al. (1997b) these questions were answered positively for the mean
SPM concentration. Here the questions will be answered for the temporal variation (expressed as standard deviation factors) of the SPM concentrations. In the
7 5 t 5
8
standard deviation factor
of depth averaged
SPM concentration
computed date
W. PuIs· T. Pohlmann· J. Siindermann
o 1- 1.6
1.6 - 2
2 - 2.6
_
> 2.6
Fig.14 Horizontal distribution of the temporal variation of depth-averaged SPM concentrations in the southern North Sea, computed for comparison with the measured SPM data
shown in Fig. 13. The temporal variation of SPM concentrations is expressed by a so-called
standard deviation factor, defined in the text. The position of the numbers in the plot are the
positions of the NSP stations. Each number indicates the number of SPM concentrations entering into the determination of the station's standard deviation factor. The shading between the stations is obtained from inter- or extrapolation
5
Representativity of NSP SPM Data
The measured distribution of the temporal variation of SPM concentrations
shown in Fig. 13 is based on a limited number of stations and on a limited
number of measurements per station. There are two questions concerning the
distribution given in Fig. l3:
1. Was the number of measurements per station (i.e. the frequency of NSP survey cruises) sufficient for being representative for the whole period August
1988-0ctober 1989 (time representativity)?
2. Was the number of stations and their spatial arrangement adequately chosen
in order to yield a sufficient spatial coverage of the whole area of the southern
North Sea (space representativity)?
In PuIs et al. (1997b) these questions were answered positively for the mean
SPM concentration. Here the questions will be answered for the temporal variation (expressed as standard deviation factors) of the SPM concentrations. In the