

Model Simulation ofTemporal Variability of Suspended Matter in the North Sea
47
D
0 .1 - 0 .3
-
0 .3 - 10
-
to - 3
-
3 - 6
-
>6
mgtl
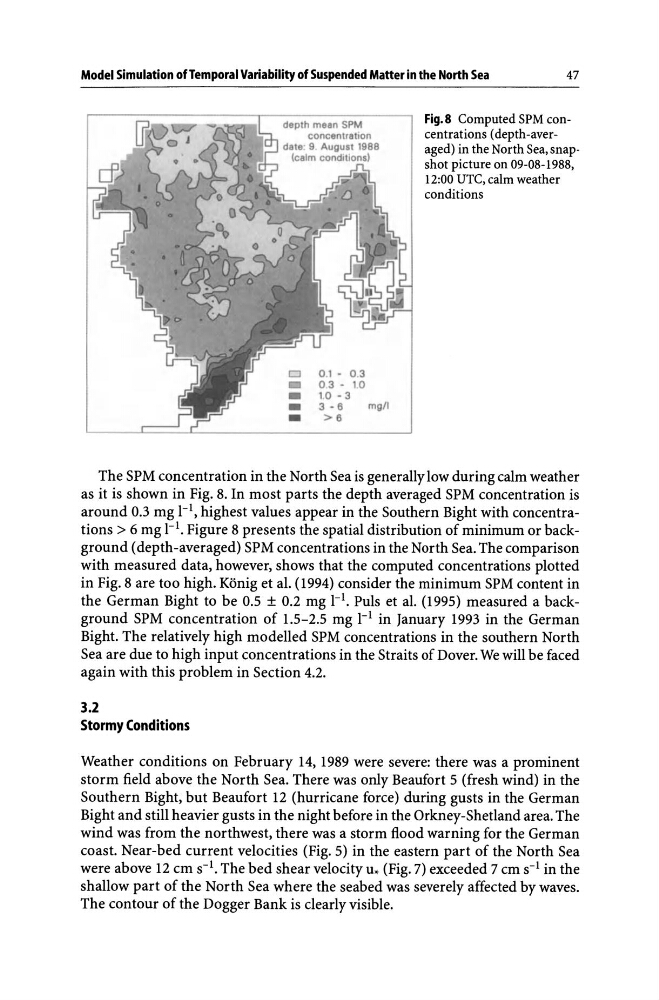
Fig.8 Computed SPM concentrations (depth-averaged) in the North Sea, snapshot picture on 09-08-1988,
12:00 UTC, calm weather
conditions
The SPM concentration in the North Sea is generally low during calm weather
as it is shown in Fig. 8. In most parts the depth averaged SPM concentration is
around 0.3 mg 1-1, highest values appear in the Southern Bight with concentrations > 6 mg 1-1. Figure 8 presents the spatial distribution of minimum or background (depth-averaged) SPM concentrations in the North Sea. The comparison
with measured data, however, shows that the computed concentrations plotted
in Fig. 8 are too high. Konig et al. (1994) consider the minimum SPM content in
the German Bight to be 0.5 ± 0.2 mg 1-1. PuIs et al. (1995) measured a background SPM concentration of 1.5-2.5 mg 1-1 in January 1993 in the German
Bight. The relatively high modelled SPM concentrations in the southern North
Sea are due to high input concentrations in the Straits of Dover. We will be faced
again with this problem in Section 4.2.
3.2
Stormy Conditions
Weather conditions on February 14, 1989 were severe: there was a prominent
storm field above the North Sea. There was only Beaufort 5 (fresh wind) in the
Southern Bight, but Beaufort 12 (hurricane force) during gusts in the German
Bight and still heavier gusts in the night before in the Orkney-Shetland area. The
wind was from the northwest, there was a storm flood warning for the German
coast. Near-bed current velocities (Fig. 5) in the eastern part of the North Sea
were above 12 cm s-l. The bed shear velocity u* (Fig. 7) exceeded 7 cm S-1 in the
shallow part of the North Sea where the seabed was severely affected by waves.
The contour of the Dogger Bank is clearly visible.
47
D
0 .1 - 0 .3
-
0 .3 - 10
-
to - 3
-
3 - 6
-
>6
mgtl
Fig.8 Computed SPM concentrations (depth-averaged) in the North Sea, snapshot picture on 09-08-1988,
12:00 UTC, calm weather
conditions
The SPM concentration in the North Sea is generally low during calm weather
as it is shown in Fig. 8. In most parts the depth averaged SPM concentration is
around 0.3 mg 1-1, highest values appear in the Southern Bight with concentrations > 6 mg 1-1. Figure 8 presents the spatial distribution of minimum or background (depth-averaged) SPM concentrations in the North Sea. The comparison
with measured data, however, shows that the computed concentrations plotted
in Fig. 8 are too high. Konig et al. (1994) consider the minimum SPM content in
the German Bight to be 0.5 ± 0.2 mg 1-1. PuIs et al. (1995) measured a background SPM concentration of 1.5-2.5 mg 1-1 in January 1993 in the German
Bight. The relatively high modelled SPM concentrations in the southern North
Sea are due to high input concentrations in the Straits of Dover. We will be faced
again with this problem in Section 4.2.
3.2
Stormy Conditions
Weather conditions on February 14, 1989 were severe: there was a prominent
storm field above the North Sea. There was only Beaufort 5 (fresh wind) in the
Southern Bight, but Beaufort 12 (hurricane force) during gusts in the German
Bight and still heavier gusts in the night before in the Orkney-Shetland area. The
wind was from the northwest, there was a storm flood warning for the German
coast. Near-bed current velocities (Fig. 5) in the eastern part of the North Sea
were above 12 cm s-l. The bed shear velocity u* (Fig. 7) exceeded 7 cm S-1 in the
shallow part of the North Sea where the seabed was severely affected by waves.
The contour of the Dogger Bank is clearly visible.