

46
W. PuIs· T. Pohlmann· J. Siindermann
sity gradients and wind only, tidal currents are not shown. Maximum near-bed
current velocities are between 2 and 6 cm S-l; in the southern North Sea they are
below 2 cm S-l.
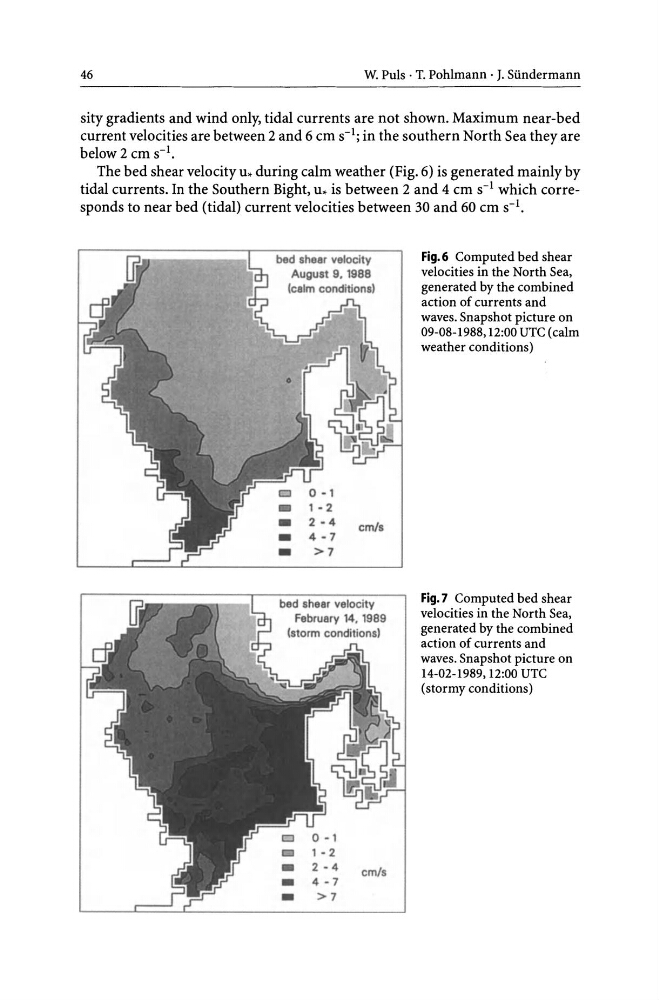
The bed shear velocity u. during calm weather (Fig. 6) is generated mainly by
tidal currents. In the Southern Bight, u. is between 2 and 4 cm S-l which corresponds to near bed (tidal) current velocities between 30 and 60 cm S-l.
1 - 2
_
2-4
_
4-7
_
>7
em/s
Fig.6 Computed bed shear
velocities in the North Sea,
generated by the combined
action of currents and
waves. Snapshot picture on
09-08-1988,12:00 UTC (calm
weather conditions)
Fig.7 Computed bed shear
velocities in the North Sea,
generated by the combined
action of currents and
waves. Snapshot picture on
14-02-1989,12:00 UTC
(stormy conditions)
W. PuIs· T. Pohlmann· J. Siindermann
sity gradients and wind only, tidal currents are not shown. Maximum near-bed
current velocities are between 2 and 6 cm S-l; in the southern North Sea they are
below 2 cm S-l.
The bed shear velocity u. during calm weather (Fig. 6) is generated mainly by
tidal currents. In the Southern Bight, u. is between 2 and 4 cm S-l which corresponds to near bed (tidal) current velocities between 30 and 60 cm S-l.
1 - 2
_
2-4
_
4-7
_
>7
em/s
Fig.6 Computed bed shear
velocities in the North Sea,
generated by the combined
action of currents and
waves. Snapshot picture on
09-08-1988,12:00 UTC (calm
weather conditions)
Fig.7 Computed bed shear
velocities in the North Sea,
generated by the combined
action of currents and
waves. Snapshot picture on
14-02-1989,12:00 UTC
(stormy conditions)