

48
W. PuIs · T. Pohlmann· J. Siindermann
depth mean SPM
concentration
date 14 February 1989
(storm conditions)
0
01 - 0 .3
03 - 10
-
10 - 3
-
3 - 6
mgll
-
>6
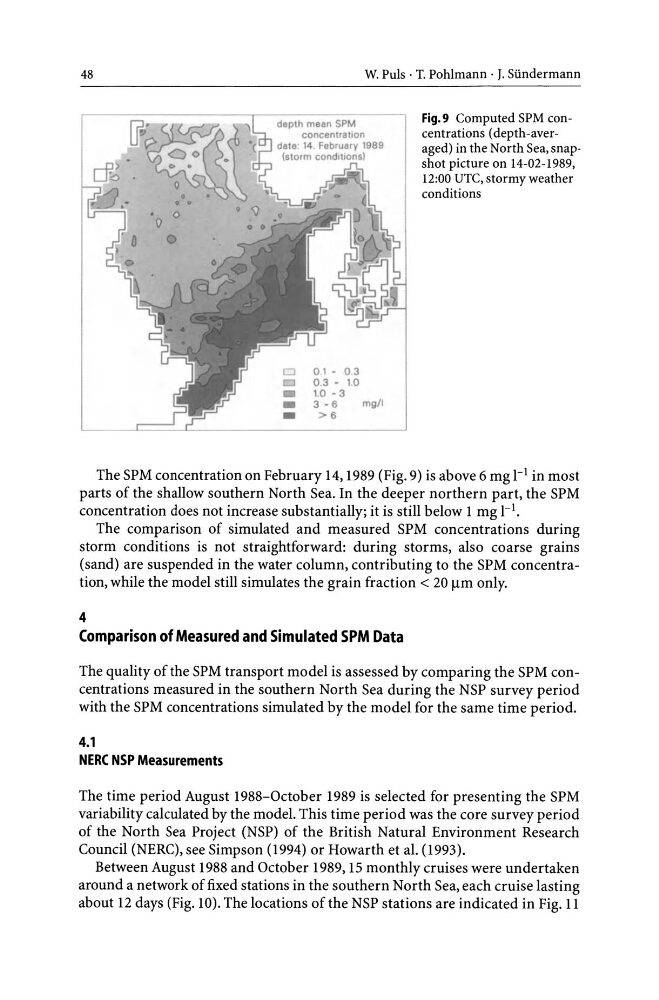
Fig.9 Computed SPM concentrations (depth-averaged) in the North Sea, snap·
shot picture on 14-02-1989,
12:00 UTC, stormy weather
conditions
The SPM concentration on February 14, 1989 (Fig. 9) is above 6 mg 1-1 in most
parts of the shallow southern North Sea. In the deeper northern part, the SPM
concentration does not increase substantially; it is still below 1 mg 1-1.
The comparison of simulated and measured SPM concentrations during
storm conditions is not straightforward: during storms, also coarse grains
(sand) are suspended in the water column, contributing to the SPM concentration, while the model still simulates the grain fraction < 20 11m only.
4
Comparison of Measured and Simulated SPM Data
The quality of the SPM transport model is assessed by comparing the SPM concentrations measured in the southern North Sea during the NSP survey period
with the SPM concentrations simulated by the model for the same time period.
4.1
NERC NSP Measurements
The time period August 1988-0ctober 1989 is selected for presenting the SPM
variability calculated by the model. This time period was the core survey period
of the North Sea Project (NSP) of the British Natural Environment Research
Council (NERC), see Simpson (1994) or Howarth et al. (1993).
Between August 1988 and October 1989, 15 monthly cruises were undertaken
around a network of fixed stations in the southern North Sea, each cruise lasting
about 12 days (Fig. 10). The locations of the NSP stations are indicated in Fig. 11
W. PuIs · T. Pohlmann· J. Siindermann
depth mean SPM
concentration
date 14 February 1989
(storm conditions)
0
01 - 0 .3
03 - 10
-
10 - 3
-
3 - 6
mgll
-
>6
Fig.9 Computed SPM concentrations (depth-averaged) in the North Sea, snap·
shot picture on 14-02-1989,
12:00 UTC, stormy weather
conditions
The SPM concentration on February 14, 1989 (Fig. 9) is above 6 mg 1-1 in most
parts of the shallow southern North Sea. In the deeper northern part, the SPM
concentration does not increase substantially; it is still below 1 mg 1-1.
The comparison of simulated and measured SPM concentrations during
storm conditions is not straightforward: during storms, also coarse grains
(sand) are suspended in the water column, contributing to the SPM concentration, while the model still simulates the grain fraction < 20 11m only.
4
Comparison of Measured and Simulated SPM Data
The quality of the SPM transport model is assessed by comparing the SPM concentrations measured in the southern North Sea during the NSP survey period
with the SPM concentrations simulated by the model for the same time period.
4.1
NERC NSP Measurements
The time period August 1988-0ctober 1989 is selected for presenting the SPM
variability calculated by the model. This time period was the core survey period
of the North Sea Project (NSP) of the British Natural Environment Research
Council (NERC), see Simpson (1994) or Howarth et al. (1993).
Between August 1988 and October 1989, 15 monthly cruises were undertaken
around a network of fixed stations in the southern North Sea, each cruise lasting
about 12 days (Fig. 10). The locations of the NSP stations are indicated in Fig. 11