

30
100
N2
NS
100
10L-_ _ _ - ' '
I~~ __ _L _ _ ~ _ _ L_~~~ _ _ _ _ _ _ L_~~~
S
11
13
15
Days "'''' 1993
J. Lou· T. Wolf· W. Rosenthal
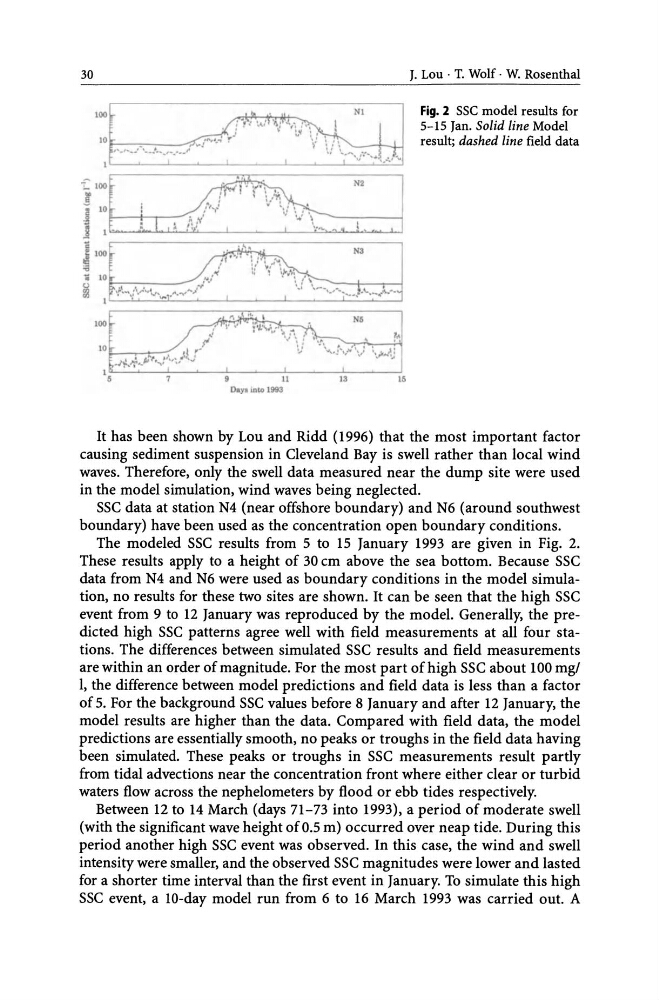
Fig. 2 sse model results for
5-15 Jan. Solid line Model
result; dashed line field data
It has been shown by Lou and Ridd (1996) that the most important factor
causing sediment suspension in Cleveland Bay is swell rather than local wind
waves. Therefore, only the swell data measured near the dump site were used
in the model simulation, wind waves being neglected.
sse data at station N4 (near offshore boundary) and N6 (around southwest
boundary) have been used as the concentration open boundary conditions.
The modeled sse results from 5 to 15 January 1993 are given in Fig. 2.
These results apply to a height of 30 cm above the sea bottom. Because sse
data from N4 and N6 were used as boundary conditions in the model simulation, no results for these two sites are shown. It can be seen that the high sse
event from 9 to 12 January was reproduced by the model. Generally, the predicted high sse patterns agree well with field measurements at all four stations. The differences between simulated sse results and field measurements
are within an order of magnitude. For the most part of high sse about 100 mgt
1, the difference between model predictions and field data is less than a factor
of 5. For the background sse values before 8 January and after 12 January, the
model results are higher than the data. Compared with field data, the model
predictions are essentially smooth, no peaks or troughs in the field data having
been simulated. These peaks or troughs in sse measurements result partly
from tidal advections near the concentration front where either clear or turbid
waters flow across the nephelometers by flood or ebb tides respectively.
Between 12 to 14 March (days 71-73 into 1993), a period of moderate swell
(with the significant wave height of 0.5 m) occurred over neap tide. During this
period another high sse event was observed. In this case, the wind and swell
intensity were smaller, and the observed sse magnitudes were lower and lasted
for a shorter time interval than the first event in January. To simulate this high
sse event, a lO-day model run from 6 to 16 March 1993 was carried out. A
100
N2
NS
100
10L-_ _ _ - ' '
I~~ __ _L _ _ ~ _ _ L_~~~ _ _ _ _ _ _ L_~~~
S
11
13
15
Days "'''' 1993
J. Lou· T. Wolf· W. Rosenthal
Fig. 2 sse model results for
5-15 Jan. Solid line Model
result; dashed line field data
It has been shown by Lou and Ridd (1996) that the most important factor
causing sediment suspension in Cleveland Bay is swell rather than local wind
waves. Therefore, only the swell data measured near the dump site were used
in the model simulation, wind waves being neglected.
sse data at station N4 (near offshore boundary) and N6 (around southwest
boundary) have been used as the concentration open boundary conditions.
The modeled sse results from 5 to 15 January 1993 are given in Fig. 2.
These results apply to a height of 30 cm above the sea bottom. Because sse
data from N4 and N6 were used as boundary conditions in the model simulation, no results for these two sites are shown. It can be seen that the high sse
event from 9 to 12 January was reproduced by the model. Generally, the predicted high sse patterns agree well with field measurements at all four stations. The differences between simulated sse results and field measurements
are within an order of magnitude. For the most part of high sse about 100 mgt
1, the difference between model predictions and field data is less than a factor
of 5. For the background sse values before 8 January and after 12 January, the
model results are higher than the data. Compared with field data, the model
predictions are essentially smooth, no peaks or troughs in the field data having
been simulated. These peaks or troughs in sse measurements result partly
from tidal advections near the concentration front where either clear or turbid
waters flow across the nephelometers by flood or ebb tides respectively.
Between 12 to 14 March (days 71-73 into 1993), a period of moderate swell
(with the significant wave height of 0.5 m) occurred over neap tide. During this
period another high sse event was observed. In this case, the wind and swell
intensity were smaller, and the observed sse magnitudes were lower and lasted
for a shorter time interval than the first event in January. To simulate this high
sse event, a lO-day model run from 6 to 16 March 1993 was carried out. A