

Modeling Sediment Resuspension in Coastal Areas
29
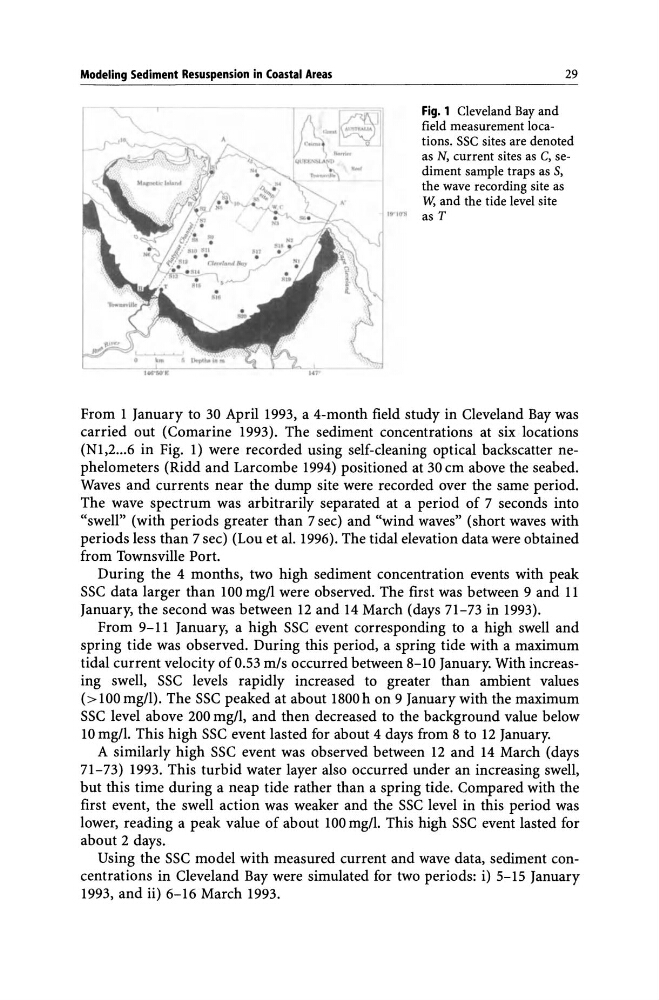
Fig. 1 Cleveland Bay and
field measurement locations. SSC sites are denoted
as N, current sites as C, sediment sample traps as S,
the wave recording site as
W, and the tide level site
,",0' 6 as T
From 1 January to 30 April 1993, a 4-month field study in Cleveland Bay was
carried out (Comarine 1993). The sediment concentrations at six locations
(Nl,2 ... 6 in Fig. 1) were recorded using self-cleaning optical backscatter nephelometers (Ridd and Larcombe 1994) positioned at 30 cm above the seabed.
Waves and currents near the dump site were recorded over the same period.
The wave spectrum was arbitrarily separated at a period of 7 seconds into
"swell" (with periods greater than 7 sec) and "wind waves" (short waves with
periods less than 7 sec) (Lou et al. 1996). The tidal elevation data were obtained
from Townsville Port.
During the 4 months, two high sediment concentration events with peak
SSC data larger than 100 mg/l were observed. The first was between 9 and 11
January, the second was between 12 and 14 March (days 7l-73 in 1993).
From 9-11 January, a high SSC event corresponding to a high swell and
spring tide was observed. During this period, a spring tide with a maximum
tidal current velocity of 0.53 m/s occurred between 8-10 January. With increasing swell, SSC levels rapidly increased to greater than ambient values
(>100mg/I). The SSC peaked at about 1800h on 9 January with the maximum
SSC level above 200 mg/l, and then decreased to the background value below
10 mg/I. This high SSC event lasted for about 4 days from 8 to 12 January.
A similarly high SSC event was observed between 12 and 14 March (days
71-73) 1993. This turbid water layer also occurred under an increasing swell,
but this time during a neap tide rather than a spring tide. Compared with the
first event, the swell action was weaker and the SSC level in this period was
lower, reading a peak value of about 100 mg/I. This high SSC event lasted for
about 2 days.
Using the SSC model with measured current and wave data, sediment concentrations in Cleveland Bay were simulated for two periods: i) 5-15 January
1993, and ii) 6-16 March 1993.
29
Fig. 1 Cleveland Bay and
field measurement locations. SSC sites are denoted
as N, current sites as C, sediment sample traps as S,
the wave recording site as
W, and the tide level site
,",0' 6 as T
From 1 January to 30 April 1993, a 4-month field study in Cleveland Bay was
carried out (Comarine 1993). The sediment concentrations at six locations
(Nl,2 ... 6 in Fig. 1) were recorded using self-cleaning optical backscatter nephelometers (Ridd and Larcombe 1994) positioned at 30 cm above the seabed.
Waves and currents near the dump site were recorded over the same period.
The wave spectrum was arbitrarily separated at a period of 7 seconds into
"swell" (with periods greater than 7 sec) and "wind waves" (short waves with
periods less than 7 sec) (Lou et al. 1996). The tidal elevation data were obtained
from Townsville Port.
During the 4 months, two high sediment concentration events with peak
SSC data larger than 100 mg/l were observed. The first was between 9 and 11
January, the second was between 12 and 14 March (days 7l-73 in 1993).
From 9-11 January, a high SSC event corresponding to a high swell and
spring tide was observed. During this period, a spring tide with a maximum
tidal current velocity of 0.53 m/s occurred between 8-10 January. With increasing swell, SSC levels rapidly increased to greater than ambient values
(>100mg/I). The SSC peaked at about 1800h on 9 January with the maximum
SSC level above 200 mg/l, and then decreased to the background value below
10 mg/I. This high SSC event lasted for about 4 days from 8 to 12 January.
A similarly high SSC event was observed between 12 and 14 March (days
71-73) 1993. This turbid water layer also occurred under an increasing swell,
but this time during a neap tide rather than a spring tide. Compared with the
first event, the swell action was weaker and the SSC level in this period was
lower, reading a peak value of about 100 mg/I. This high SSC event lasted for
about 2 days.
Using the SSC model with measured current and wave data, sediment concentrations in Cleveland Bay were simulated for two periods: i) 5-15 January
1993, and ii) 6-16 March 1993.