

396
C. Barcelo· V. Pawlowsky . G. Bohling
Table 4 Hierarchical clustering groups versus air-groups
Hierarchic
Put into new aIr-groups
(initial)
2
3
4
5
6
groups
1
61
89
8
3
0
0
2
27
75
172
107
0
0
3
18
25
62
79
3
0
4
9
21
61
121
1
0
5
0
4
10
100
99
0
6
0
0
2
45
0
7
12
4
2
3
13
Total
125
218
316
413
151
13
2.3
Mixture Clustering Model over the BC-Transformed Data
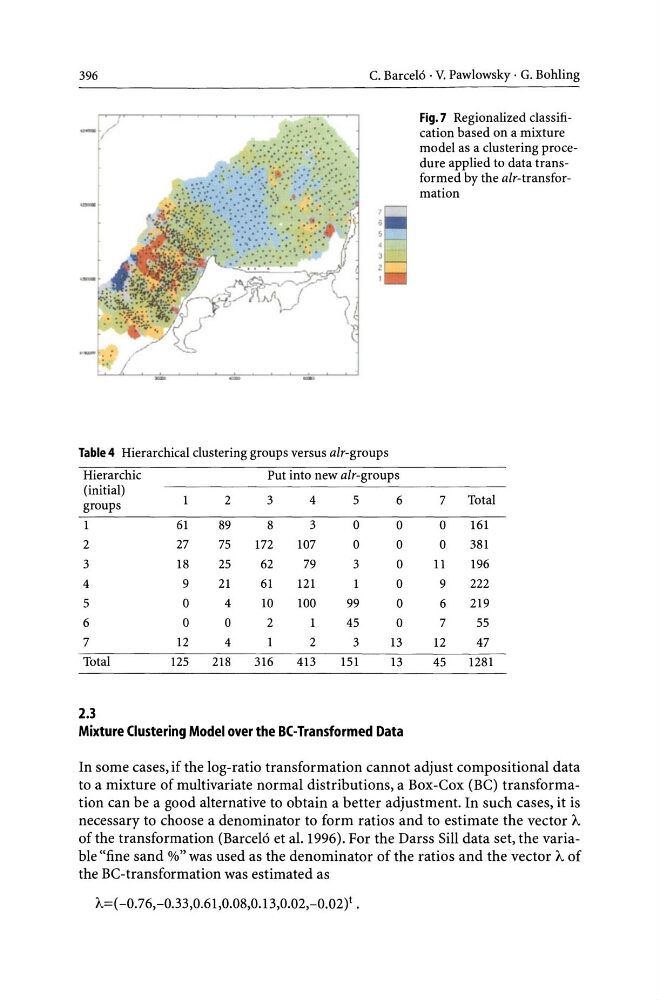
Fig.7 Regionalized classification based on a mixture
model as a clustering procedure applied to data transformed by the aIr-transformation
7
Total
0
161
0
381
11
196
9
222
6
219
7
55
12
47
45
1281
In some cases, if the log-ratio transformation cannot adjust compositional data
to a mixture of multivariate normal distributions, a Box-Cox (BC) transformation can be a good alternative to obtain a better adjustment. In such cases, it is
necessary to choose a denominator to form ratios and to estimate the vector A
of the transformation (Barcelo et al.I996). For the Darss Sill data set, the variable "fine sand %" was used as the denominator of the ratios and the vector A of
the BC-transformation was estimated as
A=( -0.76,-0.33,0.61,0.08,0.13,0.02,-0.02)t .
C. Barcelo· V. Pawlowsky . G. Bohling
Table 4 Hierarchical clustering groups versus air-groups
Hierarchic
Put into new aIr-groups
(initial)
2
3
4
5
6
groups
1
61
89
8
3
0
0
2
27
75
172
107
0
0
3
18
25
62
79
3
0
4
9
21
61
121
1
0
5
0
4
10
100
99
0
6
0
0
2
45
0
7
12
4
2
3
13
Total
125
218
316
413
151
13
2.3
Mixture Clustering Model over the BC-Transformed Data
Fig.7 Regionalized classification based on a mixture
model as a clustering procedure applied to data transformed by the aIr-transformation
7
Total
0
161
0
381
11
196
9
222
6
219
7
55
12
47
45
1281
In some cases, if the log-ratio transformation cannot adjust compositional data
to a mixture of multivariate normal distributions, a Box-Cox (BC) transformation can be a good alternative to obtain a better adjustment. In such cases, it is
necessary to choose a denominator to form ratios and to estimate the vector A
of the transformation (Barcelo et al.I996). For the Darss Sill data set, the variable "fine sand %" was used as the denominator of the ratios and the vector A of
the BC-transformation was estimated as
A=( -0.76,-0.33,0.61,0.08,0.13,0.02,-0.02)t .