

Classification of Compositional Data Using Mixture Models: a Case Study Using Granulometric Data 395
90
80
70
80
welght%
50
40
30
20
10
0
fs
2
3
5
groups
grv-mfs
•
•
• •
• • •
•
• 9'"
0 \CS
cs
• ms
0 mfs
Cl Is
0 >As
D Sin
6
•
vfs-s ilt
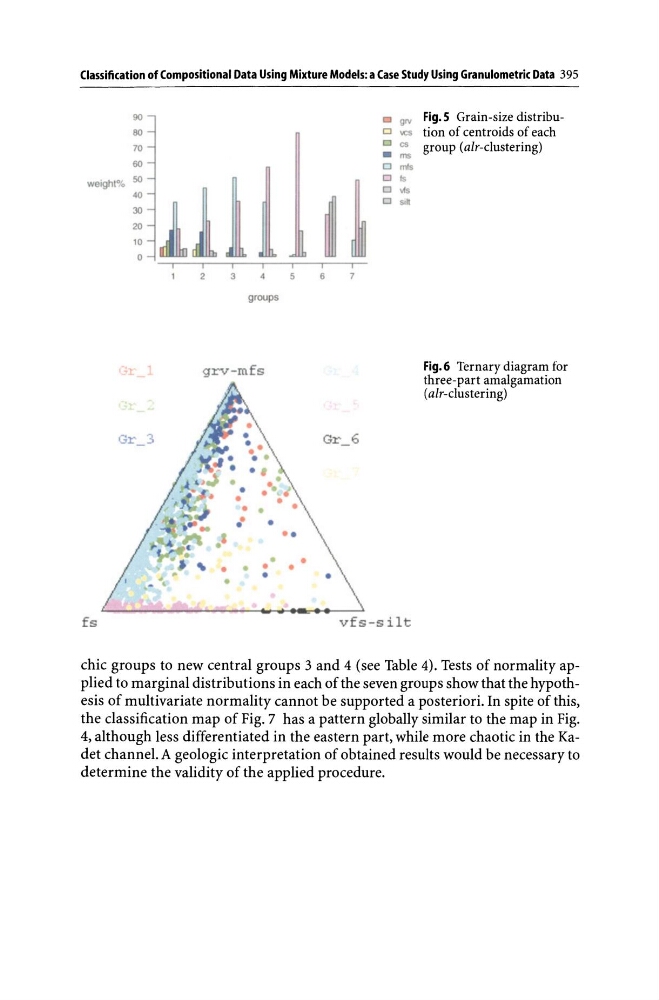
Fig.S Grain-size distribution of centroids of each
group (aIr-clustering)
Fig.6 Ternary diagram for
three-part amalgamation
(aIr-clustering)
chic groups to new central groups 3 and 4 (see Table 4). Tests of normality applied to marginal distributions in each of the seven groups show that the hypothesis of multivariate normality cannot be supported a posteriori. In spite of this,
the classification map of Fig. 7 has a pattern globally similar to the map in Fig.
4, although less differentiated in the eastern part, while more chaotic in the Kadet channel. A geologic interpretation of obtained results would be necessary to
determine the validity of the applied procedure.
90
80
70
80
welght%
50
40
30
20
10
0
fs
2
3
5
groups
grv-mfs
•
•
• •
• • •
•
• 9'"
0 \CS
cs
• ms
0 mfs
Cl Is
0 >As
D Sin
6
•
vfs-s ilt
Fig.S Grain-size distribution of centroids of each
group (aIr-clustering)
Fig.6 Ternary diagram for
three-part amalgamation
(aIr-clustering)
chic groups to new central groups 3 and 4 (see Table 4). Tests of normality applied to marginal distributions in each of the seven groups show that the hypothesis of multivariate normality cannot be supported a posteriori. In spite of this,
the classification map of Fig. 7 has a pattern globally similar to the map in Fig.
4, although less differentiated in the eastern part, while more chaotic in the Kadet channel. A geologic interpretation of obtained results would be necessary to
determine the validity of the applied procedure.