

Classification of Compositional Data Using Mixture Models: a Case Study Using Granulometric Data 397
TableS Grain-size distribution of centroids of each group (BC-clustering)
Gr
N
Gravel vcsand csand msand mffsand vfsand Silt
sand
276
0.7
4.4
8.8
17.0
43.6
20.8
3.1
1.7
21.5%
2
84
0.0
0.0
2.6
11.7
72.3
7.8
4.9
0.7
6.6%
3
209
0.0
0.0
0.9
4.1
62.3
29.2
2.8
0.8
16.3%
4
505
0.0
0.0
0.4
1.5
21.4
69.8
5.8
1.1
39.4%
5
103
0.0
0.0
0.0
0.3
4.7
59.8
25.4
9.9
8.0%
6
23
0.0
0.0
0.0
0.1
1.7
25.2
34.6
40.4
1.8%
7
81
6.4
5.9
7.8
12.3
28.9
25.0
5.8
7.9
6.3%
Fig.8 Grain-size distribu90
•
grv
tion of centroids of each
80
CJ ..:s group (BC-clustering)
C$
70
• ms
80
CJ m!s
50
CJ Is
weighl%
CJ vis
40
CJ 81.
30
20
10
0
2
3
5
6
7
groups
The seven groups obtained from hierarchical clustering analysis were used to
estimate A with the additional hypothesis of homoscedasticity of transformed
groups. After the Be-transformation was applied to the granulometric data, the
EM-algorithm was executed in the same fashion as in the air case (Section 2.2).
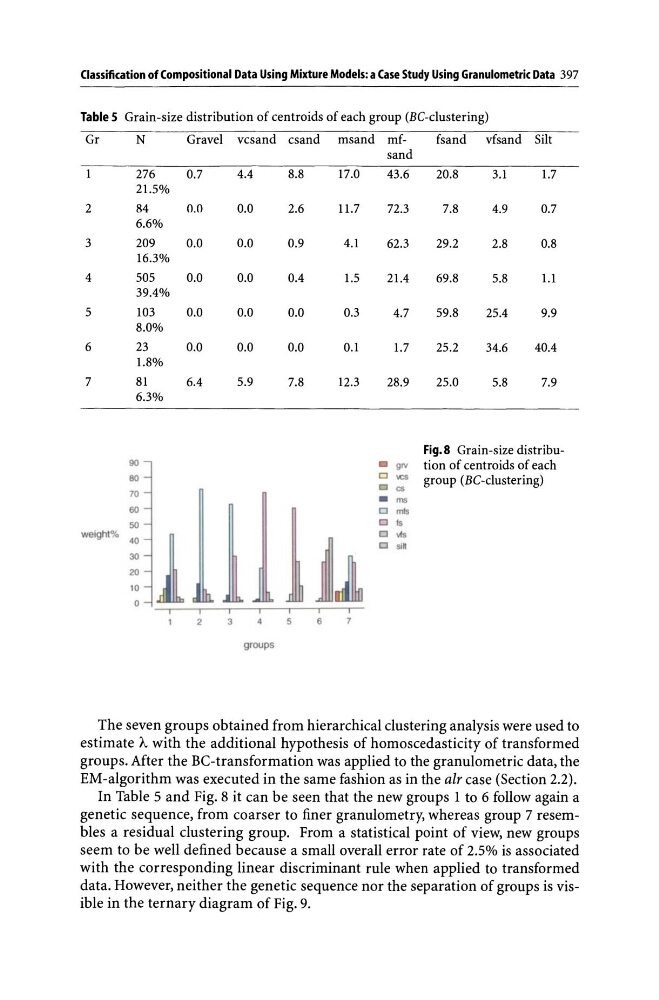
In Table 5 and Fig. 8 it can be seen that the new groups 1 to 6 follow again a
genetic sequence, from coarser to finer granulometry, whereas group 7 resembles a residual clustering group. From a statistical point of view, new groups
seem to be well defined because a small overall error rate of 2.5% is associated
with the corresponding linear discriminant rule when applied to transformed
data. However, neither the genetic sequence nor the separation of groups is visible in the ternary diagram of Fig. 9.
TableS Grain-size distribution of centroids of each group (BC-clustering)
Gr
N
Gravel vcsand csand msand mffsand vfsand Silt
sand
276
0.7
4.4
8.8
17.0
43.6
20.8
3.1
1.7
21.5%
2
84
0.0
0.0
2.6
11.7
72.3
7.8
4.9
0.7
6.6%
3
209
0.0
0.0
0.9
4.1
62.3
29.2
2.8
0.8
16.3%
4
505
0.0
0.0
0.4
1.5
21.4
69.8
5.8
1.1
39.4%
5
103
0.0
0.0
0.0
0.3
4.7
59.8
25.4
9.9
8.0%
6
23
0.0
0.0
0.0
0.1
1.7
25.2
34.6
40.4
1.8%
7
81
6.4
5.9
7.8
12.3
28.9
25.0
5.8
7.9
6.3%
Fig.8 Grain-size distribu90
•
grv
tion of centroids of each
80
CJ ..:s group (BC-clustering)
C$
70
• ms
80
CJ m!s
50
CJ Is
weighl%
CJ vis
40
CJ 81.
30
20
10
0
2
3
5
6
7
groups
The seven groups obtained from hierarchical clustering analysis were used to
estimate A with the additional hypothesis of homoscedasticity of transformed
groups. After the Be-transformation was applied to the granulometric data, the
EM-algorithm was executed in the same fashion as in the air case (Section 2.2).
In Table 5 and Fig. 8 it can be seen that the new groups 1 to 6 follow again a
genetic sequence, from coarser to finer granulometry, whereas group 7 resembles a residual clustering group. From a statistical point of view, new groups
seem to be well defined because a small overall error rate of 2.5% is associated
with the corresponding linear discriminant rule when applied to transformed
data. However, neither the genetic sequence nor the separation of groups is visible in the ternary diagram of Fig. 9.