

368
Oto-I m
., to-2m
-2tD-3m
-3to-4m
-4to·5m
-5to-1;m
-6to-7 m
JI1
-7to-8m
~
"
..ate -9m
1 -9to-10m
-10 to -11 m
-11 to -12 m
-12Io-13m
13 to ·14 m
-14 to-15 m
-15to-16m
100al volume
-100
B
~
- 5='
• ~
1.-------'
-80
-40
davfallon "' ""
-20
•
ISM - I observBlJon poont(aog tized lsd,nH)
o ISM - 8 -..rvatlon poonts (1)0<- dala)
o IoIaCGRIDZO - 8 observBlJon pol,lS (1)0<- data)
o Su~er - 8 ot>serva_ poonlS (borehole data)
20
C. Hoselmann . H. Streif
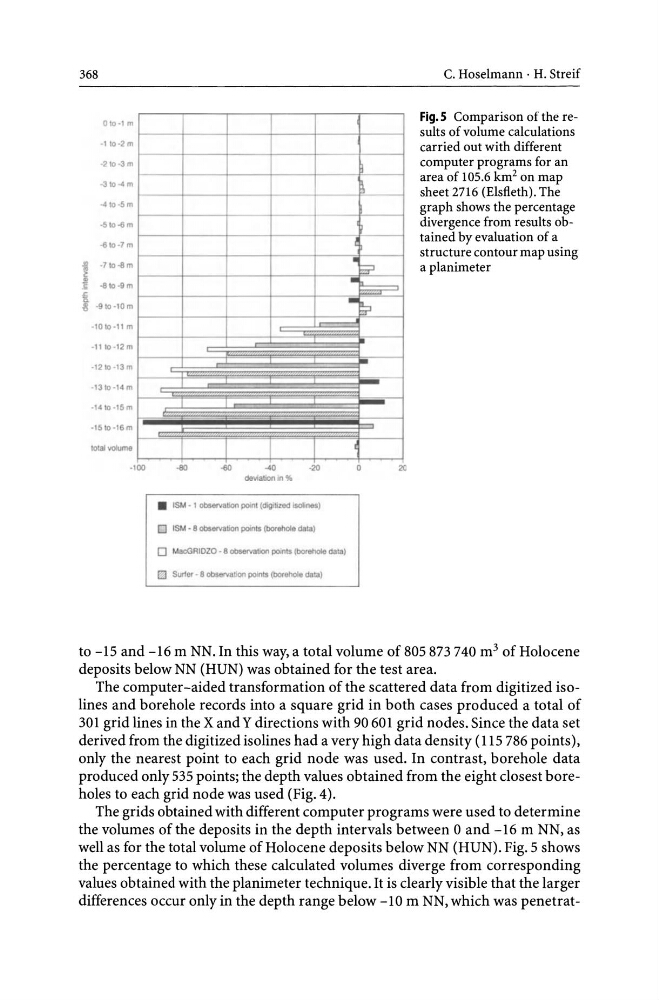
Fig.5 Comparison of the results of volume calculations
carried out with different
computer programs for an
area of 105.6 km 2 on map
sheet 2716 (Elsfleth). The
graph shows the percentage
divergence from results obtained by evaluation of a
structure contour map using
a planimeter
to -15 and -16 m NN. In this way, a total volume of 805 873 740 m 3 of Holocene
deposits below NN (HUN) was obtained for the test area.
The computer-aided transformation of the scattered data from digitized isolines and borehole records into a square grid in both cases produced a total of
301 grid lines in the X and Y directions with 90 601 grid nodes. Since the data set
derived from the digitized isolines had a very high data density (115786 points),
only the nearest point to each grid node was used. In contrast, borehole data
produced only 535 points; the depth values obtained from the eight closest boreholes to each grid node was used (Fig. 4).
The grids obtained with different computer programs were used to determine
the volumes of the deposits in the depth intervals between 0 and -16 m NN, as
well as for the total volume of Holocene deposits below NN (HUN). Fig. 5 shows
the percentage to which these calculated volumes diverge from corresponding
values obtained with the planimeter technique. It is clearly visible that the larger
differences occur only in the depth range below -10m NN, which was penetrat-
Oto-I m
., to-2m
-2tD-3m
-3to-4m
-4to·5m
-5to-1;m
-6to-7 m
JI1
-7to-8m
~
"
..ate -9m
1 -9to-10m
-10 to -11 m
-11 to -12 m
-12Io-13m
13 to ·14 m
-14 to-15 m
-15to-16m
100al volume
-100
B
~
- 5='
• ~
1.-------'
-80
-40
davfallon "' ""
-20
•
ISM - I observBlJon poont(aog tized lsd,nH)
o ISM - 8 -..rvatlon poonts (1)0<- dala)
o IoIaCGRIDZO - 8 observBlJon pol,lS (1)0<- data)
o Su~er - 8 ot>serva_ poonlS (borehole data)
20
C. Hoselmann . H. Streif
Fig.5 Comparison of the results of volume calculations
carried out with different
computer programs for an
area of 105.6 km 2 on map
sheet 2716 (Elsfleth). The
graph shows the percentage
divergence from results obtained by evaluation of a
structure contour map using
a planimeter
to -15 and -16 m NN. In this way, a total volume of 805 873 740 m 3 of Holocene
deposits below NN (HUN) was obtained for the test area.
The computer-aided transformation of the scattered data from digitized isolines and borehole records into a square grid in both cases produced a total of
301 grid lines in the X and Y directions with 90 601 grid nodes. Since the data set
derived from the digitized isolines had a very high data density (115786 points),
only the nearest point to each grid node was used. In contrast, borehole data
produced only 535 points; the depth values obtained from the eight closest boreholes to each grid node was used (Fig. 4).
The grids obtained with different computer programs were used to determine
the volumes of the deposits in the depth intervals between 0 and -16 m NN, as
well as for the total volume of Holocene deposits below NN (HUN). Fig. 5 shows
the percentage to which these calculated volumes diverge from corresponding
values obtained with the planimeter technique. It is clearly visible that the larger
differences occur only in the depth range below -10m NN, which was penetrat-