

238
A. Paul· W. H. Berger
dic transitions between episodes of near-40 ka-period oscillations (associated
with the ice-calving instability) and near-IOO ka-period oscillations (associated
with the global carbon cycle instability).
We now assume that the tectonically-induced level of atmospheric CO2 decreases linearly by about 100 ppm over the last 5 Ma (Saltzman and Verbitsky
1993). Thus, we take
(7)
where ii* = 253 ppm and /l = -20 ppm/Ma, such that ii = 353 ppm at
t = -5 Ma. All other parameter values are also similar to those for case II of
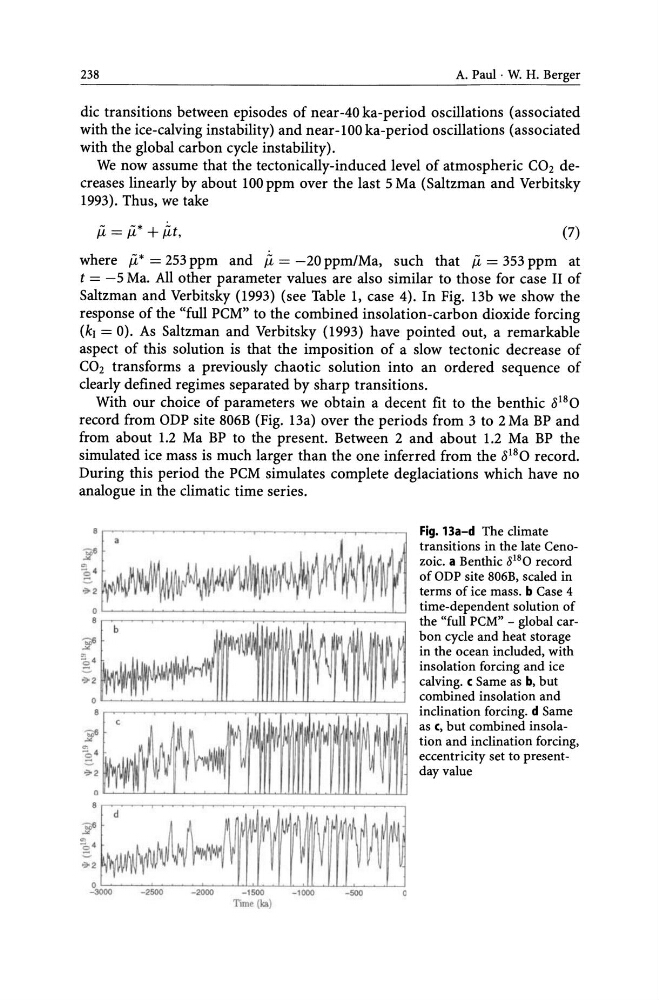
Saltzman and Verbitsky (1993) (see Table 1, case 4). In Fig. 13b we show the
response of the "full PCM" to the combined insolation-carbon dioxide forcing
(kJ = 0). As Saltzman and Verbitsky (1993) have pointed out, a remarkable
aspect of this solution is that the imposition of a slow tectonic decrease of
CO2 transforms a previously chaotic solution into an ordered sequence of
clearly defined regimes separated by sharp transitions.
With our choice of parameters we obtain a decent fit to the benthic 8 18 0
record from ODP site 806B (Fig. 13a) over the periods from 3 to 2 Ma BP and
from about 1.2 Ma BP to the present. Between 2 and about 1.2 Ma BP the
simulated ice mass is much larger than the one inferred from the 8 18 0 record.
During this period the PCM simulates complete deglaciations which have no
analogue in the climatic time series.
~
OL-____ ~ ____ ~ ____ - L _ _ _ _ ~ _ _ _ _ ~~ _ _ ~
~~
~~I~~
--3000
-2000
-2000
-1000
-1000
-000
0
Time (Ita)
Fig. 13a-d The climate
transitions in the late Cenozoic. a Benthic 8 18 0 record
of ODP site 806B, scaled in
terms of ice mass. b Case 4
time-dependent solution of
the "full PCM" - global carbon cycle and heat storage
in the ocean included, with
insolation forcing and ice
calving. c Same as b, but
combined insolation and
inclination forcing. d Same
as c, but combined insolation and inclination forcing,
eccentricity set to presentday value
A. Paul· W. H. Berger
dic transitions between episodes of near-40 ka-period oscillations (associated
with the ice-calving instability) and near-IOO ka-period oscillations (associated
with the global carbon cycle instability).
We now assume that the tectonically-induced level of atmospheric CO2 decreases linearly by about 100 ppm over the last 5 Ma (Saltzman and Verbitsky
1993). Thus, we take
(7)
where ii* = 253 ppm and /l = -20 ppm/Ma, such that ii = 353 ppm at
t = -5 Ma. All other parameter values are also similar to those for case II of
Saltzman and Verbitsky (1993) (see Table 1, case 4). In Fig. 13b we show the
response of the "full PCM" to the combined insolation-carbon dioxide forcing
(kJ = 0). As Saltzman and Verbitsky (1993) have pointed out, a remarkable
aspect of this solution is that the imposition of a slow tectonic decrease of
CO2 transforms a previously chaotic solution into an ordered sequence of
clearly defined regimes separated by sharp transitions.
With our choice of parameters we obtain a decent fit to the benthic 8 18 0
record from ODP site 806B (Fig. 13a) over the periods from 3 to 2 Ma BP and
from about 1.2 Ma BP to the present. Between 2 and about 1.2 Ma BP the
simulated ice mass is much larger than the one inferred from the 8 18 0 record.
During this period the PCM simulates complete deglaciations which have no
analogue in the climatic time series.
~
OL-____ ~ ____ ~ ____ - L _ _ _ _ ~ _ _ _ _ ~~ _ _ ~
~~
~~I~~
--3000
-2000
-2000
-1000
-1000
-000
0
Time (Ita)
Fig. 13a-d The climate
transitions in the late Cenozoic. a Benthic 8 18 0 record
of ODP site 806B, scaled in
terms of ice mass. b Case 4
time-dependent solution of
the "full PCM" - global carbon cycle and heat storage
in the ocean included, with
insolation forcing and ice
calving. c Same as b, but
combined insolation and
inclination forcing. d Same
as c, but combined insolation and inclination forcing,
eccentricity set to presentday value