

Climate Cycles and Climate Transitions . ..
231
period, in the record from ODP site 806B. In the same two time series the precessional peaks with periods near 23 and 19 ka are well separated. In the record
from ODP site 659, the obliquity as well as the precessional peaks are smeared
out. Our point is here that the raw spectra have large standard errors, which do
not allow to regard the separate peaks with a period near 100 ka as significant,
neither in the tuned nor in the untuned time series. As in the work of Saltzman
and Verbitsky, we use the SPECMAP stack as our target for the late Pleistocene.
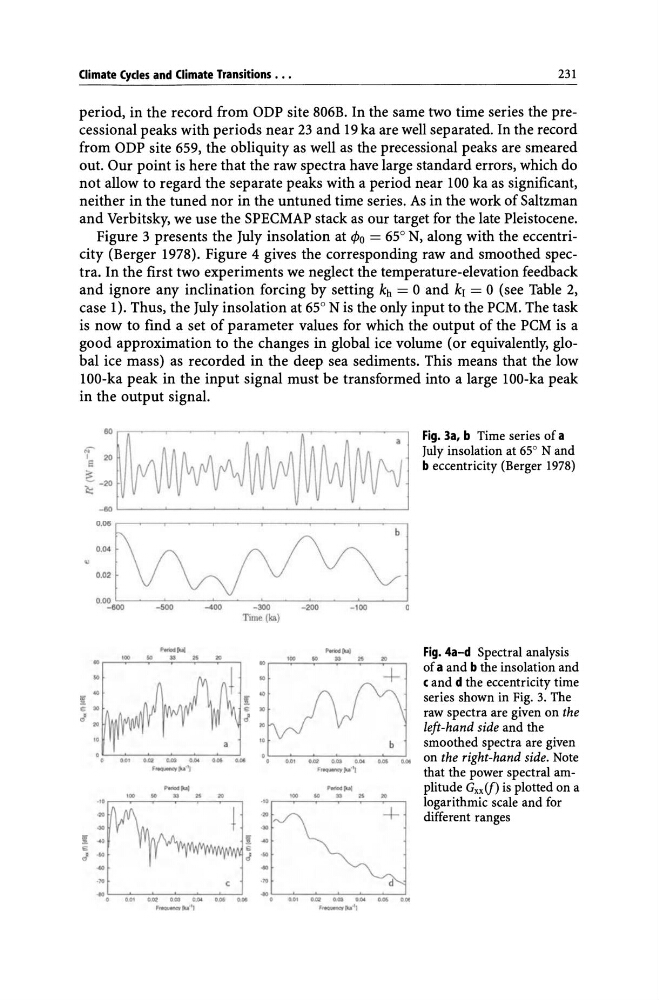
Figure 3 presents the July insolation at
case 1). Thus, the July insolation at 65° N is the only input to the PCM. The task
is now to find a set of parameter values for which the output of the PCM is a
good approximation to the changes in global ice volume (or equivalently, global ice mass) as recorded in the deep sea sediments. This means that the low
100-ka peak in the input signal must be transformed into a large 100-ka peak
in the output signal.
i~~1
':~I o.OO-6=OO,----;_SOO=----4-:::00:-----3OQ=-:---_=2OQ-:----_-:':'OOc:------!O
Time (lea)
p..wDt-l
p.m.s ful
. . ,., . . . . 2<
,00
so
. . " '"
. .
+
. .
. .
I:
"
>D
J '"
"
b
.. .. .... o.IM . . ... • • .. , .. .. .... .... ... ""
F~[U-~
F~[II.I· I)
....... 1' .01
... ., " " . .
· 20
+...
I:
....
" J
-to
...
.,.
c
. ,.
d
...
...
. .... .... ... ... ... •
0,0'
.. .. . ... . ... ... ...
F~",, ' II
~EQ·'I
Fig. 3a, b Time series of a
July insolation at 65° Nand
b eccentricity (Berger 1978)
Fig. 4a-d Spectral analysis
of a and b the insolation and
c and d the eccentricity time
series shown in Fig. 3. The
raw spectra are given on the
left-hand side and the
smoothed spectra are given
on the right-hand side. Note
that the power spectral amplitude Gxxlf) is plotted on a
logarithmic scale and for
different ranges
231
period, in the record from ODP site 806B. In the same two time series the precessional peaks with periods near 23 and 19 ka are well separated. In the record
from ODP site 659, the obliquity as well as the precessional peaks are smeared
out. Our point is here that the raw spectra have large standard errors, which do
not allow to regard the separate peaks with a period near 100 ka as significant,
neither in the tuned nor in the untuned time series. As in the work of Saltzman
and Verbitsky, we use the SPECMAP stack as our target for the late Pleistocene.
Figure 3 presents the July insolation at
case 1). Thus, the July insolation at 65° N is the only input to the PCM. The task
is now to find a set of parameter values for which the output of the PCM is a
good approximation to the changes in global ice volume (or equivalently, global ice mass) as recorded in the deep sea sediments. This means that the low
100-ka peak in the input signal must be transformed into a large 100-ka peak
in the output signal.
i~~1
':~I o.OO-6=OO,----;_SOO=----4-:::00:-----3OQ=-:---_=2OQ-:----_-:':'OOc:------!O
Time (lea)
p..wDt-l
p.m.s ful
. . ,., . . . . 2<
,00
so
. . " '"
. .
+
. .
. .
I:
"
>D
J '"
"
b
.. .. .... o.IM . . ... • • .. , .. .. .... .... ... ""
F~[U-~
F~[II.I· I)
....... 1' .01
... ., " " . .
· 20
+...
I:
....
" J
-to
...
.,.
c
. ,.
d
...
...
. .... .... ... ... ... •
0,0'
.. .. . ... . ... ... ...
F~",, ' II
~EQ·'I
Fig. 3a, b Time series of a
July insolation at 65° Nand
b eccentricity (Berger 1978)
Fig. 4a-d Spectral analysis
of a and b the insolation and
c and d the eccentricity time
series shown in Fig. 3. The
raw spectra are given on the
left-hand side and the
smoothed spectra are given
on the right-hand side. Note
that the power spectral amplitude Gxxlf) is plotted on a
logarithmic scale and for
different ranges