

230
t~
L~l
il§~1
-600
-500
.... 00
-300
-200
-100
0
Tnne (""J
_1'01
. . . . as . .
. .
I
" •
J •
4
..
,.
b
"
·,s
• .•. ... ... .... ... ... • .. .. ... "" .... •• ...
~IU'I
~""I
....... ~
-. ...
... . . . . " . .
... . . . . as . .
"
. .
+
. .
·t.
... d
·to
...
· ... .... ... .... ... .... •
0.0'
0. ..
.... .... . . .. ....
~t.&11
_
... ·1
_Il0l
-. ...
. . . . ,. . .
... . . . . " . .
. .
+
. .
.. e
. "
...
... . . .
• ... ... ... .... ... . . . •
• Of
.oo ... ....
F,..,..."p;.-'J
'......, ... -11
A. Paul· W. H. Berger
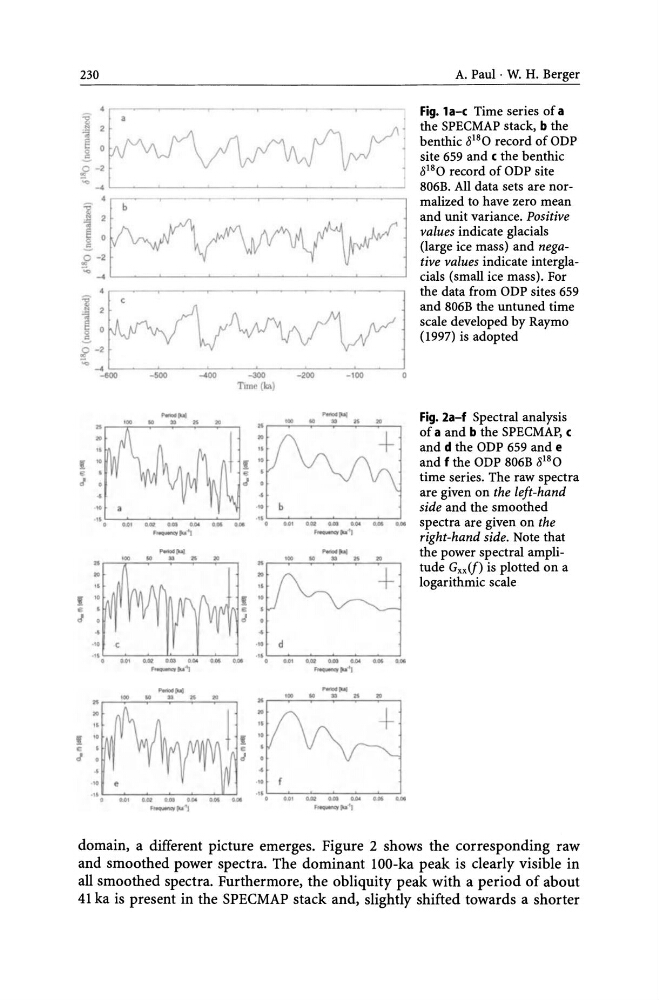
Fig. la-c Time series of a
the SPECMAP stack, b the
benthic 8 18 0 record of ODP
site 659 and c the benthic
8 18 0 record of ODP site
806B. All data sets are normalized to have zero mean
and unit variance. Positive
values indicate gladals
(large ice mass) and negative values indicate intergladals (small ice mass). For
the data from ODP sites 659
and 806B the untuned time
scale developed by Raymo
(1997) is adopted
Fig. 2a-f Spectral analysis
of a and b the SPECMAP, c
and d the ODP 659 and e
and f the ODP 806B 8 18 0
time series. The raw spectra
are given on the left-hand
side and the smoothed
spectra are given on the
right-hand side. Note that
the power spectral amplitude Gxxlf) is plotted on a
logarithmic scale
domain, a different picture emerges. Figure 2 shows the corresponding raw
and smoothed power spectra. The dominant 100-ka peak is clearly visible in
all smoothed spectra. Furthermore, the obliquity peak with a period of about
41 ka is present in the SPECMAP stack and, slightly shifted towards a shorter
t~
L~l
il§~1
-600
-500
.... 00
-300
-200
-100
0
Tnne (""J
_1'01
. . . . as . .
. .
I
" •
J •
4
..
,.
b
"
·,s
• .•. ... ... .... ... ... • .. .. ... "" .... •• ...
~IU'I
~""I
....... ~
-. ...
... . . . . " . .
... . . . . as . .
"
. .
+
. .
·t.
... d
·to
...
· ... .... ... .... ... .... •
0.0'
0. ..
.... .... . . .. ....
~t.&11
_
... ·1
_Il0l
-. ...
. . . . ,. . .
... . . . . " . .
. .
+
. .
.. e
. "
...
... . . .
• ... ... ... .... ... . . . •
• Of
.oo ... ....
F,..,..."p;.-'J
'......, ... -11
A. Paul· W. H. Berger
Fig. la-c Time series of a
the SPECMAP stack, b the
benthic 8 18 0 record of ODP
site 659 and c the benthic
8 18 0 record of ODP site
806B. All data sets are normalized to have zero mean
and unit variance. Positive
values indicate gladals
(large ice mass) and negative values indicate intergladals (small ice mass). For
the data from ODP sites 659
and 806B the untuned time
scale developed by Raymo
(1997) is adopted
Fig. 2a-f Spectral analysis
of a and b the SPECMAP, c
and d the ODP 659 and e
and f the ODP 806B 8 18 0
time series. The raw spectra
are given on the left-hand
side and the smoothed
spectra are given on the
right-hand side. Note that
the power spectral amplitude Gxxlf) is plotted on a
logarithmic scale
domain, a different picture emerges. Figure 2 shows the corresponding raw
and smoothed power spectra. The dominant 100-ka peak is clearly visible in
all smoothed spectra. Furthermore, the obliquity peak with a period of about
41 ka is present in the SPECMAP stack and, slightly shifted towards a shorter