

14.2 Generation and Migration ofHydrocarbons
711
O~~~~~~~~~-------------r-------,
BIOGENIC METHANE _ _ _ _
.... - --50 ..... .
IMMATURE
EARLY
MATURE
~ 100
t
O lL
FOR
OlL
L1J
a:
::J
~
a:
w
0..
:::ii
~ 150
~"'~~ W'ND01W. M~~RE
~ ,
1-----==-----1
\ ,
LATE
\ \
MATURE
\ \
FOR
\
\
OIL/
\ \
/
,\ / /
l
\
/
I
\
GENERATION
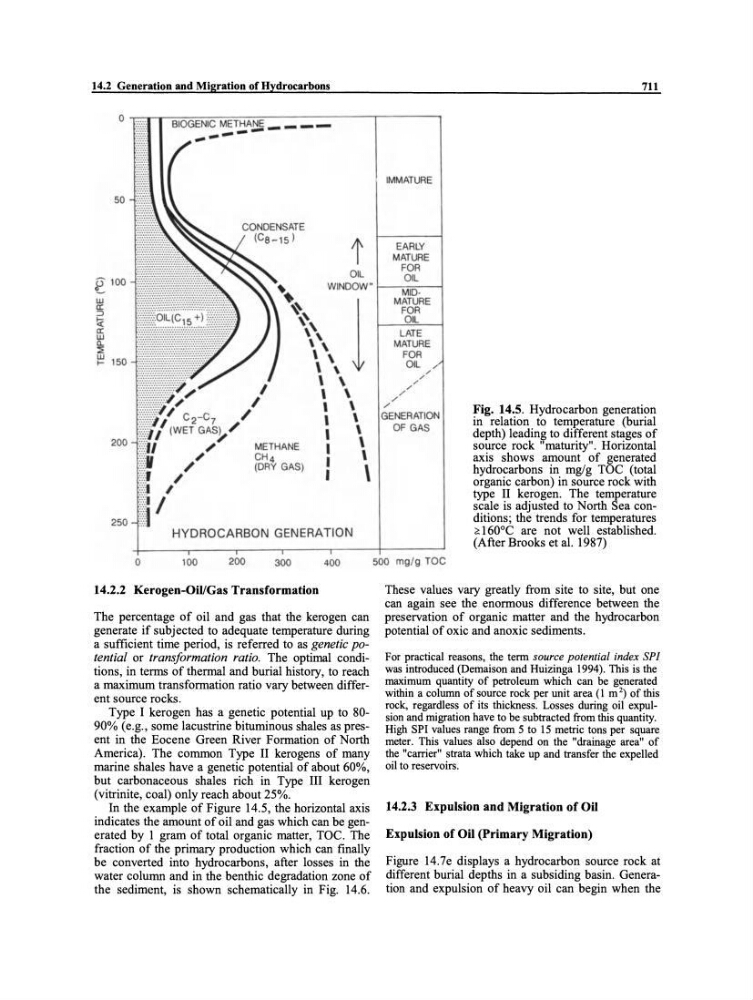
Fig. 14.5. Hydrocarbon generation
in relation to temperature (burial
depth) leading to different stages of
source rock "maturity". Horizontal
axis shows amount of generated
hydrocarbons in mg/g TOC (total
organic carbon) in source rock with
type 11 kerogen. The temperature
scale is adjusted to North Sea conditions; the trends for temperatures
~ 160°C are not well established.
(After Brooks et al. 1987)
200
I
\
OF GAS
I
\
250
o
100
200
METHANE
CH4
(DRY GAS)
300
14.2.2 Kerogen-Oil/Gas Transformation
I
\
I
\
400
The percentage of oil and gas that the kerogen can
generate if subjected to adequate temperature during
a sufficient time period, is referred to as genetie potential or transformation ratio. The optimal conditions, in terms of thermal and burial history, to reach
a maximum transformation ratio vary between different source rocks.
Type I kerogen has a genetic potential up to 8090% (e.g., some lacustrine bituminous shales as present in the Eocene Green River Formation of North
America). The common Type 11 kerogens of many
marine shales have a genetic potential of about 60%,
but carbonaceous shales rich in Type III kerogen
(vitrinite, coal) only reach about 25%.
In the example of Figure 14.5, the horizontal axis
indicates the amount of oil and gas which can be generated by 1 gram of total organic matter, TOC. The
fraction of the primary production which can finally
be converted into hydrocarbons, after losses in the
water colurnn and in the benthic degradation zone of
the sediment, is shown schematically in Fig. 14.6.
500 mg /g TOC
These values vary greatly from site to site, but one
can again see the enormous difference between the
preservation of organic matter and the hydrocarbon
potential of oxic and anoxic sediments.
For practical reasons, the term source potential index SPI
was introduced (Demaison and Huizinga 1994). This is the
maximum quantity of petroleum which can be generated
within a column of source rock per unit area (1 m 2) of this
rock, regardless of its thickness. Losses during oil expulsion and migration have to be subtracted from this quantity.
High SPI values range from 5 to 15 metric tons per square
meter. This values also depend on the "drainage area" of
the "carrier" strata which take up and transfer the expelIed
oil to reservoirs.
14.2.3 Expulsion and Migration of on
Expulsion of on (Primary Migration)
Figure 14.7e displays a hydrocarbon source rock at
different burial depths in a subsiding basin. Generation and expulsion of heavy oil can begin when the