

660
Chapter 13 Diagenesis
POROSITY.
EXPELLED PORE WATER (1)
o 200 400 600 m7m 2
o 0.1 0.2 0.3
Or--,---r---,--~--~~~~~
.,= -=- --+- , - -NORMALLY
I
TI 49
CONSOLIDATEO ,1-===-:-h S8
/
-~
~~- ----- r
:
- : - - - ,
-----r --r-----/ . . . . . . 1 + 110
h _.
, / / : I
, 'n,1
//
, I
t
,.
/'
I I
I
1 / / /
: !
~2
0W
o
..J
::J
!Xl
".
,
~/L HEIC;HT-OF - ---'r----l 88
,
PORE WATER, h~ . ~
PORE WATER
EXPULSION
I LOST FROM h2 IN ' ,'"
I
RELATION TO 11, :
: I
ii2 1
",/
, I
; ", h /; h (1=ill -1) ::
/...1 , <"
P
2 1-n ,
:
- ;----------U S2
;
" ,. , +
3
t
,.. "
I
"
,
... ", '"
I I
i . . , . ,_/
I I
,r
,
, - I
•
--,----'!'- -----U 41
,
'000 m
"
, '"
I
SEDIMENT " -
, I
i
INTERVAL
: I
,
, I
I
- -
I I
~ _ ~
I
I t
S
::-~~-u~~~_:i- ---- -Jj 34
i CONSOLIDATED __ , - - EtPELLED PORE
I
,
. -
WATER DURINO
I
, , '
TRANSITION FROM
I
_ -HIGH ER TO LOWER
I _ - "
SEDIMENT INTERVAL
EXPELLEO
..,... .... / ( '
6~--~--------------~~~--~
100 m7m 2
PORE WAtER (2)
1000
2000
3000 m' lm 2
COMPLETELY COMPACTED
o
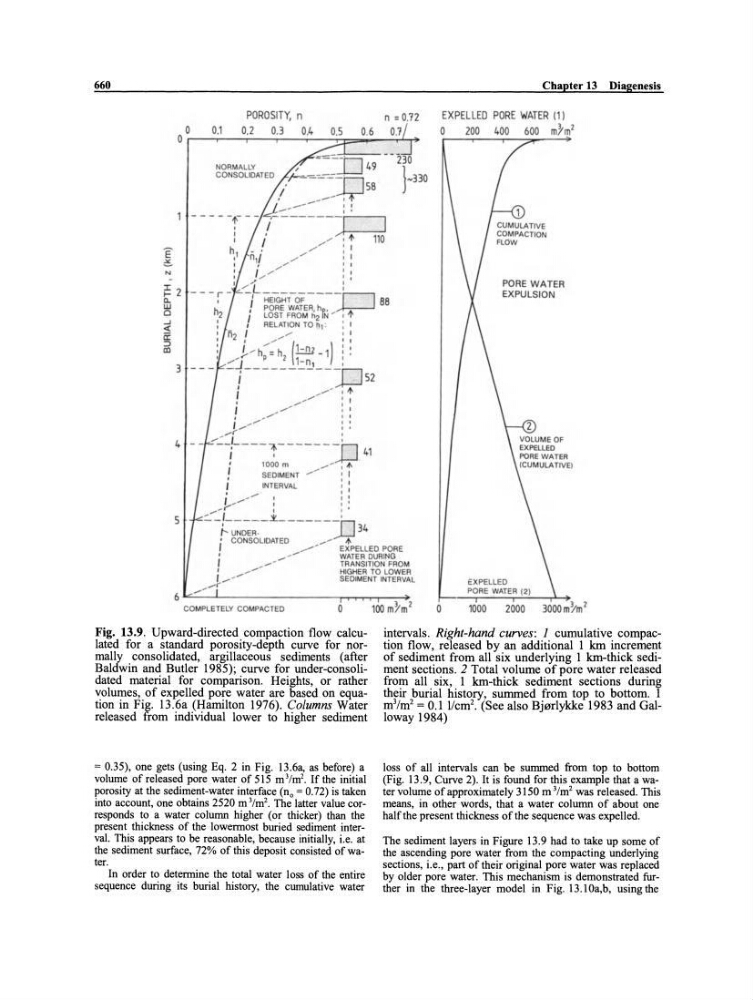
Fig. 13.9. Upward-directed compaction flow ca1culated for a standard porosity-depth curve for normally consolidated, argillaceous sediments (after
Baldwin and Butler 1985); curve for under-consolidated material for comparison. Heights, or rather
volumes, of expelled pore water are based on equation in Fig. 13.6a (Hamilton 1976). Columns Water
released from individual lower to higher sediment
= 0.35), one gets (using Eq. 2 in Fig. 13.6a, as before) a
volume of released pore water of 515 m 3 1m 2 • If the initial
porosity at the sediment-water interface (no = 0.72) is taken
into account, one obtains 2520 m 31m 2 • The latter value corresponds to a water column higher (or thicker) than the
present thickness of the lowermost buried sediment interval. This appears to be reasonable, because initially, i.e. at
the sediment surface, 72% of this deposit consisted of water.
In order to determine the total water loss of the entire
sequence during its burial history, the cumulative water
o
interva1s. Right-hand curves: J cumulative compaction flow, released by an additional 1 km increment
of sediment from all six underlying 1 km-thick sediment sections. 2 Total volume of pore water released
from aB six, 1 km-thick sediment sections during
their burial history, summed from top to bortom. 1
m 3 /m 2 = 0.1 l/cm 2 • (See also Bj0rlykke 1983 and Galloway 1984)
loss of all intervals can be surnmed from top to bottom
(Fig. 13.9, Curve 2). It is found for this example that a water volume of approxirnately 3150 m 31m 2 was released. This
means, in other words, that a water colurnn of about one
half the present thickness of the sequence was expelled.
The sediment layers in Figure 13.9 had to take up some of
the ascending pore water from the compacting underlying
sections, i.e., part of their original pore water was replaced
by older pore water. This mechanism is demonstrated further in the three-Iayer model in Fig. 13.10a,b, using the