

4 Extraction of Intermediate Scale Sea Ice Deformation Parameters from SAR Ice Motion Products
85
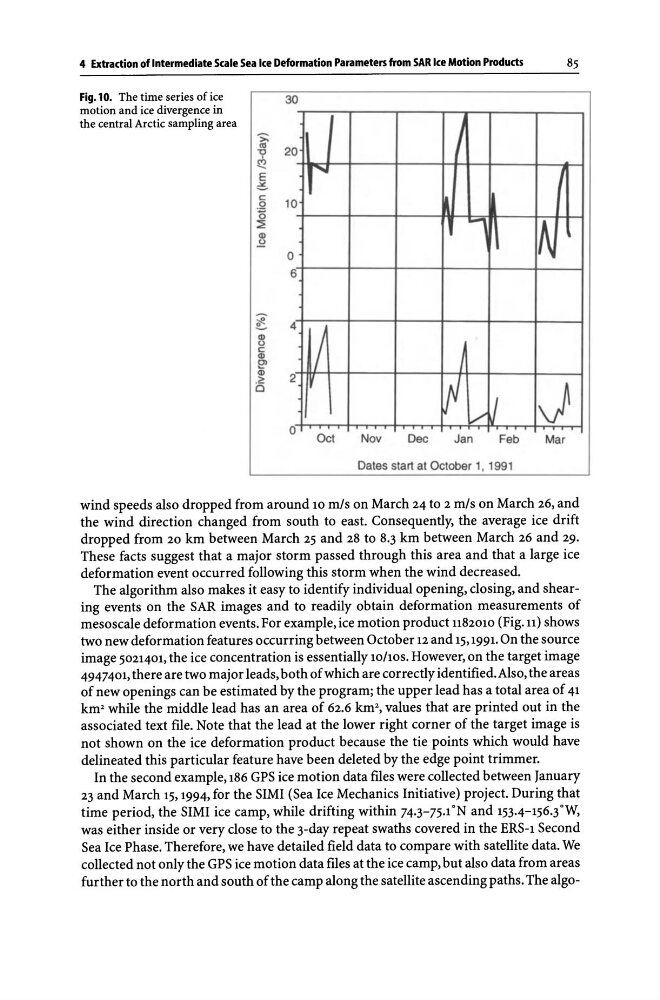
Fig.l0. The time series of ice
motion and ice divergence in
the central Arctic sampling area
>: .,
~
E
~
c
0
'5
:::!;
III
E
~
III
0
c
III
e>
0
30
20
10
0
6
4
2
0
I
I
~
I
Ii
I' . .
. ~
/
1
~ vV J
Oct
Nov
Dec
Jan
Feb
Mar
Dates start at October 1, 1991
wind speeds also dropped from around 10 mls on March 24 to 2 mls on March 26, and
the wind direction changed from south to east. Consequently, the average ice drift
dropped from 20 km between March 2S and 28 to 8.3 km between March 26 and 29.
These facts suggest that a major storm passed through this area and that a large ice
deformation event occurred following this storm when the wind decreased.
The algorithm also makes it easy to identify individual opening, closing, and shearing events on the SAR images and to readily obtain deformation measurements of
mesoscale deformation events. For example, ice motion product 1182010 (Fig. 11) shows
two new deformation features occurring between October 12 and IS, 1991. On the source
image S021401, the ice concentration is essentially 10/1OS. However, on the target image
4947401, there are two major leads, both of which are correctly identified. Also, the areas
of new openings can be estimated by the program; the upper lead has a total area of 41
km2 while the middle lead has an area of 62.6 km>, values that are printed out in the
associated text file. Note that the lead at the lower right corner of the target image is
not shown on the ice deformation product because the tie points which would have
delineated this particular feature have been deleted by the edge point trimmer.
In the second example, 186 GPS ice motion data files were collected between January
23 and March IS, 1994, for the SIMI (Sea Ice Mechanics Initiative) project. During that
time period, the SIMI ice camp, while drifting within 74.3-7S.1°N and IS3.4-1S6.3°W,
was either inside or very close to the 3-day repeat swaths covered in the ERS-l Second
Sea Ice Phase. Therefore, we have detailed field data to compare with satellite data. We
collected not only the GPS ice motion data files at the ice camp, but also data from areas
further to the north and south of the camp along the satellite ascending paths. The algo-
85
Fig.l0. The time series of ice
motion and ice divergence in
the central Arctic sampling area
>: .,
~
E
~
c
0
'5
:::!;
III
E
~
III
0
c
III
e>
0
30
20
10
0
6
4
2
0
I
I
~
I
Ii
I' . .
. ~
/
1
~ vV J
Oct
Nov
Dec
Jan
Feb
Mar
Dates start at October 1, 1991
wind speeds also dropped from around 10 mls on March 24 to 2 mls on March 26, and
the wind direction changed from south to east. Consequently, the average ice drift
dropped from 20 km between March 2S and 28 to 8.3 km between March 26 and 29.
These facts suggest that a major storm passed through this area and that a large ice
deformation event occurred following this storm when the wind decreased.
The algorithm also makes it easy to identify individual opening, closing, and shearing events on the SAR images and to readily obtain deformation measurements of
mesoscale deformation events. For example, ice motion product 1182010 (Fig. 11) shows
two new deformation features occurring between October 12 and IS, 1991. On the source
image S021401, the ice concentration is essentially 10/1OS. However, on the target image
4947401, there are two major leads, both of which are correctly identified. Also, the areas
of new openings can be estimated by the program; the upper lead has a total area of 41
km2 while the middle lead has an area of 62.6 km>, values that are printed out in the
associated text file. Note that the lead at the lower right corner of the target image is
not shown on the ice deformation product because the tie points which would have
delineated this particular feature have been deleted by the edge point trimmer.
In the second example, 186 GPS ice motion data files were collected between January
23 and March IS, 1994, for the SIMI (Sea Ice Mechanics Initiative) project. During that
time period, the SIMI ice camp, while drifting within 74.3-7S.1°N and IS3.4-1S6.3°W,
was either inside or very close to the 3-day repeat swaths covered in the ERS-l Second
Sea Ice Phase. Therefore, we have detailed field data to compare with satellite data. We
collected not only the GPS ice motion data files at the ice camp, but also data from areas
further to the north and south of the camp along the satellite ascending paths. The algo-