

s. LI, Z. CHENG, AND W.F. WEEKS
tion shows that convergence and divergence are relatively uncorrelated (r 2 = 0.076, indicating that the regression line only explains 7.6% of the total variance).
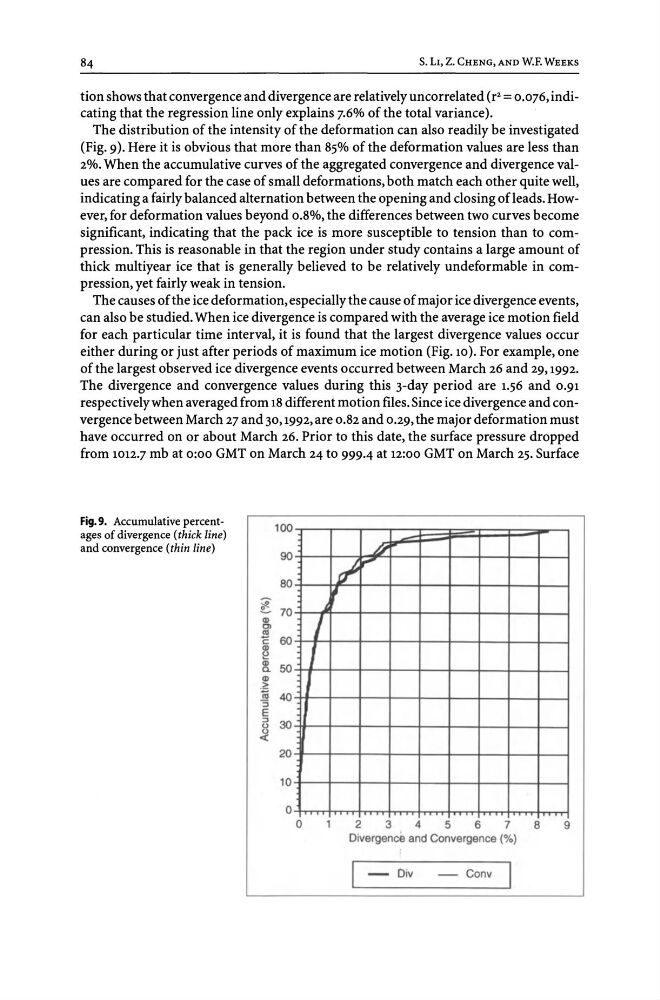
The distribution of the intensity of the deformation can also readily be investigated
(Fig. 9). Here it is obvious that more than 85% of the deformation values are less than
2%. When the accumulative curves of the aggregated convergence and divergence values are compared for the case of small deformations, both match each other quite well,
indicating a fairly balanced alternation between the opening and closing ofleads. However, for deformation values beyond 0.8%, the differences between two curves become
significant, indicating that the pack ice is more susceptible to tension than to compression. This is reasonable in that the region under study contains a large amount of
thick multiyear ice that is generally believed to be relatively undeformable in compression, yet fairly weak in tension.
The causes of the ice deformation, especially the cause of major ice divergence events,
can also be studied. When ice divergence is compared with the average ice motion field
for each particular time interval, it is found that the largest divergence values occur
either during or just after periods of maximum ice motion (Fig. 10). For example, one
of the largest observed ice divergence events occurred between March 26 and 29, 1992.
The divergence and convergence values during this 3-day period are 1.56 and 0.91
respectively when averaged from 18 different motion files. Since ice divergence and convergence between March 27 and 30, 1992, are 0.82 and 0.29, the major deformation must
have occurred on or about March 26. Prior to this date, the surface pressure dropped
from 1012.7 mb at 0:00 GMT on March 24 to 999.4 at 12:00 GMT on March 25. Surface
Fig. 9. Accumulative percentages of divergence (thick line)
and convergence (thin line)
~
L
'"
c:
~
:>
E
:>
<.>
:t.
100
90
80
70
60
50
1.
I
I
40
30
20
10
o o
.£L
rJ
.....
,
2
3
4
5
6
7
8
9
Divergence and Convergence (%)
-
Div
-
Conv
tion shows that convergence and divergence are relatively uncorrelated (r 2 = 0.076, indicating that the regression line only explains 7.6% of the total variance).
The distribution of the intensity of the deformation can also readily be investigated
(Fig. 9). Here it is obvious that more than 85% of the deformation values are less than
2%. When the accumulative curves of the aggregated convergence and divergence values are compared for the case of small deformations, both match each other quite well,
indicating a fairly balanced alternation between the opening and closing ofleads. However, for deformation values beyond 0.8%, the differences between two curves become
significant, indicating that the pack ice is more susceptible to tension than to compression. This is reasonable in that the region under study contains a large amount of
thick multiyear ice that is generally believed to be relatively undeformable in compression, yet fairly weak in tension.
The causes of the ice deformation, especially the cause of major ice divergence events,
can also be studied. When ice divergence is compared with the average ice motion field
for each particular time interval, it is found that the largest divergence values occur
either during or just after periods of maximum ice motion (Fig. 10). For example, one
of the largest observed ice divergence events occurred between March 26 and 29, 1992.
The divergence and convergence values during this 3-day period are 1.56 and 0.91
respectively when averaged from 18 different motion files. Since ice divergence and convergence between March 27 and 30, 1992, are 0.82 and 0.29, the major deformation must
have occurred on or about March 26. Prior to this date, the surface pressure dropped
from 1012.7 mb at 0:00 GMT on March 24 to 999.4 at 12:00 GMT on March 25. Surface
Fig. 9. Accumulative percentages of divergence (thick line)
and convergence (thin line)
~
L
'"
c:
~
:>
E
:>
<.>
:t.
100
90
80
70
60
50
1.
I
I
40
30
20
10
o o
.£L
rJ
.....
,
2
3
4
5
6
7
8
9
Divergence and Convergence (%)
-
Div
-
Conv