

4 Extraction of Intermediate Scale Sea Ice Deformation Parameters from SAR Ice Motion Products
83
Although three of the ice motion data files from the month of October 1991 were based
on a time interval of 6 days, the remaining 137 files were produced by determining the
positions of identical ice features separated by a time interval of 3 days. A scaling factor of 0.5 has been applied to the results obtained from the three "6-day" files. Although
this 6-month time series has an appreciable data gap in November and December 1991,
and a minor gap in February 1992, certain basic features can still be observed from the
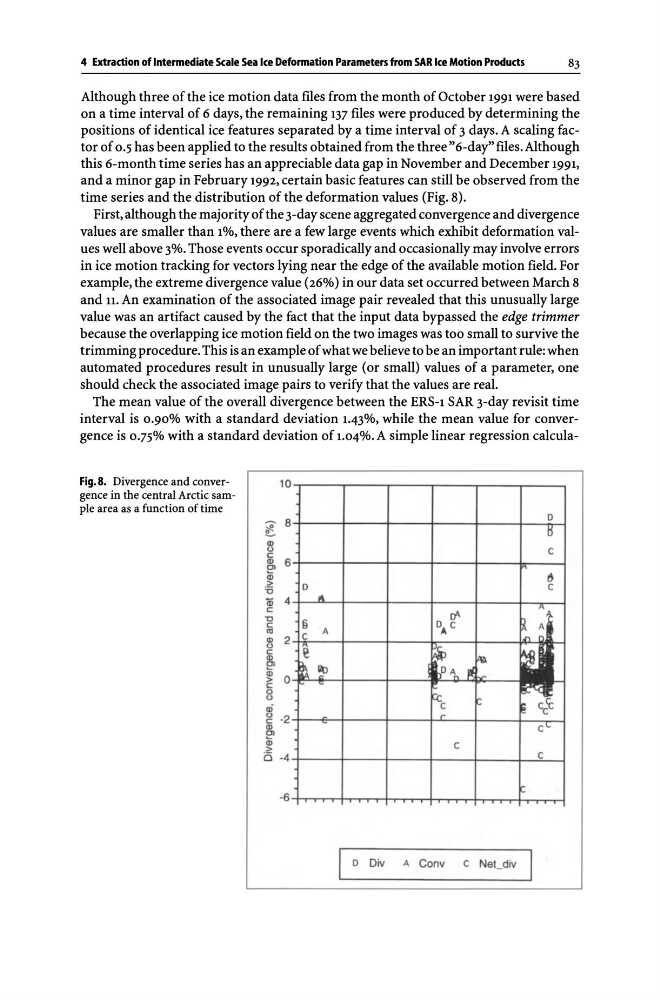
time series and the distribution of the deformation values (Fig. 8).
First, although the majority of the 3-day scene aggregated convergence and divergence
values are smaller than 1%, there are a few large events which exhibit deformation values well above 3%. Those events occur sporadically and occasionally may involve errors
in ice motion tracking for vectors lying near the edge of the available motion field. For
example, the extreme divergence value (26%) in our data set occurred between March 8
and 11. An examination of the associated image pair revealed that this unusually large
value was an artifact caused by the fact that the input data bypassed the edge trimmer
because the overlapping ice motion field on the two images was too small to survive the
trimming procedure. This is an example of what we believe to be an important rule: when
automated procedures result in unusually large (or small) values of a parameter, one
should check the associated image pairs to verify that the values are real.
The mean value of the overall divergence between the ERS-l SAR 3-day revisit time
interval is 0.90% with a standard deviation 1.43%, while the mean value for convergence is 0.75% with a standard deviation of 1.04%. A simple linear regression calculaFig.8. Divergence and convergence in the central Arctic sample area as a function of time
10
~
8
~
Q)
t)
c:
Q)
6
~
Q)
. -0
Oi 4
c:
-0
c:
ttl
fl 2
c:
Q)
C)
iii
~ 0
o t)
(jj
. o -4
-6
° ""
§ A
C
e
~~
° ts
c
6
c
A
rlDA C
~ A
r. D,
tAn ~
~
N-.r
Fcc
~ eCCe
r
c"
C
C
o Div
A COny
C Net_div
83
Although three of the ice motion data files from the month of October 1991 were based
on a time interval of 6 days, the remaining 137 files were produced by determining the
positions of identical ice features separated by a time interval of 3 days. A scaling factor of 0.5 has been applied to the results obtained from the three "6-day" files. Although
this 6-month time series has an appreciable data gap in November and December 1991,
and a minor gap in February 1992, certain basic features can still be observed from the
time series and the distribution of the deformation values (Fig. 8).
First, although the majority of the 3-day scene aggregated convergence and divergence
values are smaller than 1%, there are a few large events which exhibit deformation values well above 3%. Those events occur sporadically and occasionally may involve errors
in ice motion tracking for vectors lying near the edge of the available motion field. For
example, the extreme divergence value (26%) in our data set occurred between March 8
and 11. An examination of the associated image pair revealed that this unusually large
value was an artifact caused by the fact that the input data bypassed the edge trimmer
because the overlapping ice motion field on the two images was too small to survive the
trimming procedure. This is an example of what we believe to be an important rule: when
automated procedures result in unusually large (or small) values of a parameter, one
should check the associated image pairs to verify that the values are real.
The mean value of the overall divergence between the ERS-l SAR 3-day revisit time
interval is 0.90% with a standard deviation 1.43%, while the mean value for convergence is 0.75% with a standard deviation of 1.04%. A simple linear regression calculaFig.8. Divergence and convergence in the central Arctic sample area as a function of time
10
~
8
~
Q)
t)
c:
Q)
6
~
Q)
. -0
Oi 4
c:
-0
c:
ttl
fl 2
c:
Q)
C)
iii
~ 0
o t)
(jj
. o -4
-6
° ""
§ A
C
e
~~
° ts
c
6
c
A
rlDA C
~ A
r. D,
tAn ~
~
N-.r
Fcc
~ eCCe
r
c"
C
C
o Div
A COny
C Net_div