

2 Identifying Ice Floes and Computing Ice Floe Distributions in SAR Images
21
threshold, a Laplacian-based edginess measure is used. Figure 7d shows the results of
the water/ice mixture extraction phase.
6. Floe Size Distribution and Coverage Statistics. After the SAR image is segmented, a program is used to generate two types of numerical statistics: (1) distribution of
designated floe size bins of the image, by grouping similar floe sizes into the same bin,
and (2) ice coverage - distributions of floes, water/ice mixture and water.
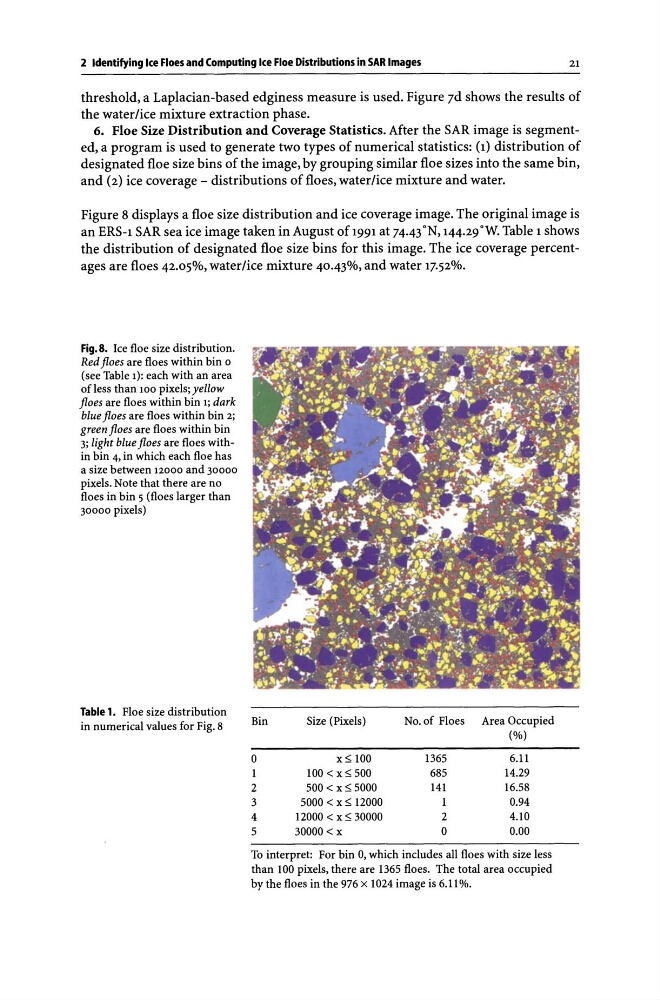
Figure 8 displays a floe size distribution and ice coverage image. The original image is
an ERS-l SAR sea ice image taken in August of 1991 at 74.43°N, 144.29°W. Table 1 shows
the distribution of designated floe size bins for this image. The ice coverage percentages are floes 42.05%, water/ice mixture 40.43%, and water 17.52%.
Fig.S. Ice floe size distribution.
Red floes are floes within bin 0
(see Table 1): each with an area
of less than 100 pixels; yellow
floes are floes within bin 1; dark
blue floes are floes within bin 2;
green flo es are floes within bin
3; light blue floes are floes within bin 4, in which each floe has
a size between 12000 and 30000
pixels. Note that there are no
floes in bin 5 (floes larger than
30000 pixels)
Table 1. Floe size distribution
in numerical values for Fig. 8
Bin
Size (Pixels)
No. of Floes
Area Occupied
(%)
0
x!> 100
1365
6.11
100 < x!> 500
685
14.29
2
500 < x !> 5000
141
16.58
3
5000 < x!> 12000
1
0.94
4
12000 < x!> 30000
2
4.10
5
30000 < x
0
0.00
To interpret: For bin 0, which includes all floes with size less
than 100 pixels, there are 1365 floes. The total area occupied
by the floes in the 976 x 1024 image is 6.11 %.
21
threshold, a Laplacian-based edginess measure is used. Figure 7d shows the results of
the water/ice mixture extraction phase.
6. Floe Size Distribution and Coverage Statistics. After the SAR image is segmented, a program is used to generate two types of numerical statistics: (1) distribution of
designated floe size bins of the image, by grouping similar floe sizes into the same bin,
and (2) ice coverage - distributions of floes, water/ice mixture and water.
Figure 8 displays a floe size distribution and ice coverage image. The original image is
an ERS-l SAR sea ice image taken in August of 1991 at 74.43°N, 144.29°W. Table 1 shows
the distribution of designated floe size bins for this image. The ice coverage percentages are floes 42.05%, water/ice mixture 40.43%, and water 17.52%.
Fig.S. Ice floe size distribution.
Red floes are floes within bin 0
(see Table 1): each with an area
of less than 100 pixels; yellow
floes are floes within bin 1; dark
blue floes are floes within bin 2;
green flo es are floes within bin
3; light blue floes are floes within bin 4, in which each floe has
a size between 12000 and 30000
pixels. Note that there are no
floes in bin 5 (floes larger than
30000 pixels)
Table 1. Floe size distribution
in numerical values for Fig. 8
Bin
Size (Pixels)
No. of Floes
Area Occupied
(%)
0
x!> 100
1365
6.11
100 < x!> 500
685
14.29
2
500 < x !> 5000
141
16.58
3
5000 < x!> 12000
1
0.94
4
12000 < x!> 30000
2
4.10
5
30000 < x
0
0.00
To interpret: For bin 0, which includes all floes with size less
than 100 pixels, there are 1365 floes. The total area occupied
by the floes in the 976 x 1024 image is 6.11 %.