

MY Po ulotion
c 2000
~
o
:;
a.
o
CL
077 080 083 086 089
DaY
MY Population
c 2000
o
~
:g
:;
a.
o 1500
CL
R.KwOK
077 080 083 086 089
OOY
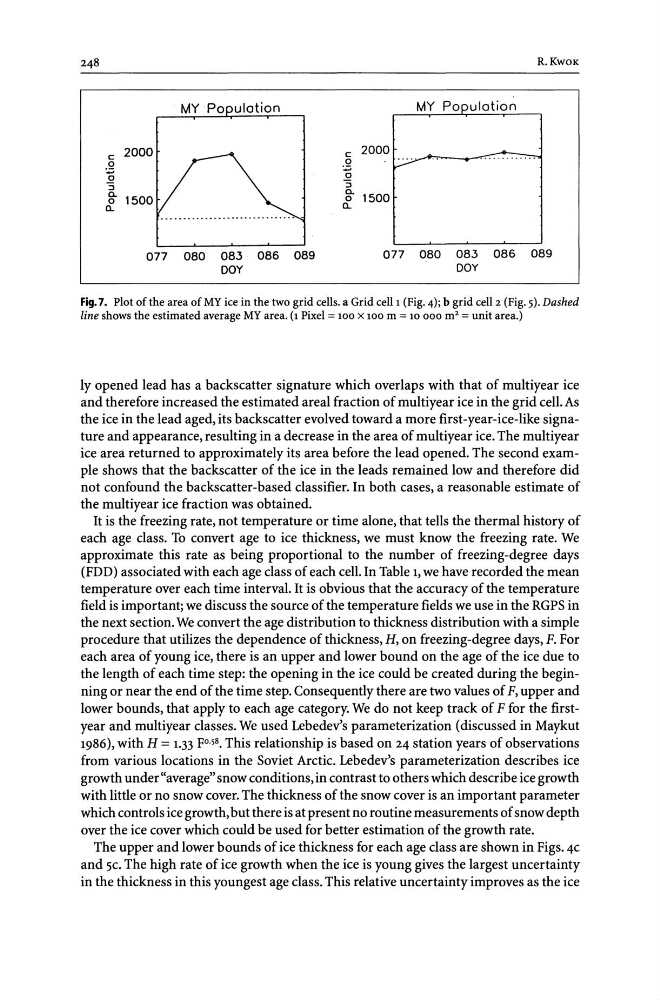
Fig. 7. Plot of the area of MY ice in the two grid cells. a Grid cellI (Fig. 4); b grid cell 2 (Fig. 5). Dashed
line shows the estimated average MY area. (1 Pixel = 100 x 100 m = 10 000 m 2 = unit area.)
ly opened lead has a backscatter signature which overlaps with that of multiyear ice
and therefore increased the estimated areal fraction of multiyear ice in the grid cell. As
the ice in the lead aged, its backscatter evolved toward a more first-year-ice-like signature and appearance, resulting in a decrease in the area of multiyear ice. The multiyear
ice area returned to approximately its area before the lead opened. The second example shows that the backscatter of the ice in the leads remained low and therefore did
not confound the backscatter-based classifier. In both cases, a reasonable estimate of
the multiyear ice fraction was obtained.
It is the freezing rate, not temperature or time alone, that tells the thermal history of
each age class. To convert age to ice thickness, we must know the freezing rate. We
approximate this rate as being proportional to the number of freezing-degree days
(FDD) associated with each age class of each cell. In Table 1, we have recorded the mean
temperature over each time interval. It is obvious that the accuracy of the temperature
field is important; we discuss the source of the temperature fields we use in the RGPS in
the next section. We convert the age distribution to thickness distribution with a simple
procedure that utilizes the dependence of thickness, H, on freezing-degree days, F. For
each area of young ice, there is an upper and lower bound on the age of the ice due to
the length of each time step: the opening in the ice could be created during the beginning or near the end of the time step. Consequently there are two values of F, upper and
lower bounds, that apply to each age category. We do not keep track of F for the firstyear and multiyear classes. We used Lebedev's parameterization (discussed in Maykut
1986), with H = 1.33 FO.5 8 • This relationship is based on 24 station years of observations
from various locations in the Soviet Arctic. Lebedev's parameterization describes ice
growth under "average" snow conditions, in contrast to others which describe ice growth
with little or no snow cover. The thickness of the snow cover is an important parameter
which controls ice growth, but there is at present no routine measurements of snow depth
over the ice cover which could be used for better estimation of the growth rate.
The upper and lower bounds of ice thickness for each age class are shown in Figs. 4C
and 5C. The high rate of ice growth when the ice is young gives the largest uncertainty
in the thickness in this youngest age class. This relative uncertainty improves as the ice
c 2000
~
o
:;
a.
o
CL
077 080 083 086 089
DaY
MY Population
c 2000
o
~
:g
:;
a.
o 1500
CL
R.KwOK
077 080 083 086 089
OOY
Fig. 7. Plot of the area of MY ice in the two grid cells. a Grid cellI (Fig. 4); b grid cell 2 (Fig. 5). Dashed
line shows the estimated average MY area. (1 Pixel = 100 x 100 m = 10 000 m 2 = unit area.)
ly opened lead has a backscatter signature which overlaps with that of multiyear ice
and therefore increased the estimated areal fraction of multiyear ice in the grid cell. As
the ice in the lead aged, its backscatter evolved toward a more first-year-ice-like signature and appearance, resulting in a decrease in the area of multiyear ice. The multiyear
ice area returned to approximately its area before the lead opened. The second example shows that the backscatter of the ice in the leads remained low and therefore did
not confound the backscatter-based classifier. In both cases, a reasonable estimate of
the multiyear ice fraction was obtained.
It is the freezing rate, not temperature or time alone, that tells the thermal history of
each age class. To convert age to ice thickness, we must know the freezing rate. We
approximate this rate as being proportional to the number of freezing-degree days
(FDD) associated with each age class of each cell. In Table 1, we have recorded the mean
temperature over each time interval. It is obvious that the accuracy of the temperature
field is important; we discuss the source of the temperature fields we use in the RGPS in
the next section. We convert the age distribution to thickness distribution with a simple
procedure that utilizes the dependence of thickness, H, on freezing-degree days, F. For
each area of young ice, there is an upper and lower bound on the age of the ice due to
the length of each time step: the opening in the ice could be created during the beginning or near the end of the time step. Consequently there are two values of F, upper and
lower bounds, that apply to each age category. We do not keep track of F for the firstyear and multiyear classes. We used Lebedev's parameterization (discussed in Maykut
1986), with H = 1.33 FO.5 8 • This relationship is based on 24 station years of observations
from various locations in the Soviet Arctic. Lebedev's parameterization describes ice
growth under "average" snow conditions, in contrast to others which describe ice growth
with little or no snow cover. The thickness of the snow cover is an important parameter
which controls ice growth, but there is at present no routine measurements of snow depth
over the ice cover which could be used for better estimation of the growth rate.
The upper and lower bounds of ice thickness for each age class are shown in Figs. 4C
and 5C. The high rate of ice growth when the ice is young gives the largest uncertainty
in the thickness in this youngest age class. This relative uncertainty improves as the ice