

160
M.R. DRINKWATER
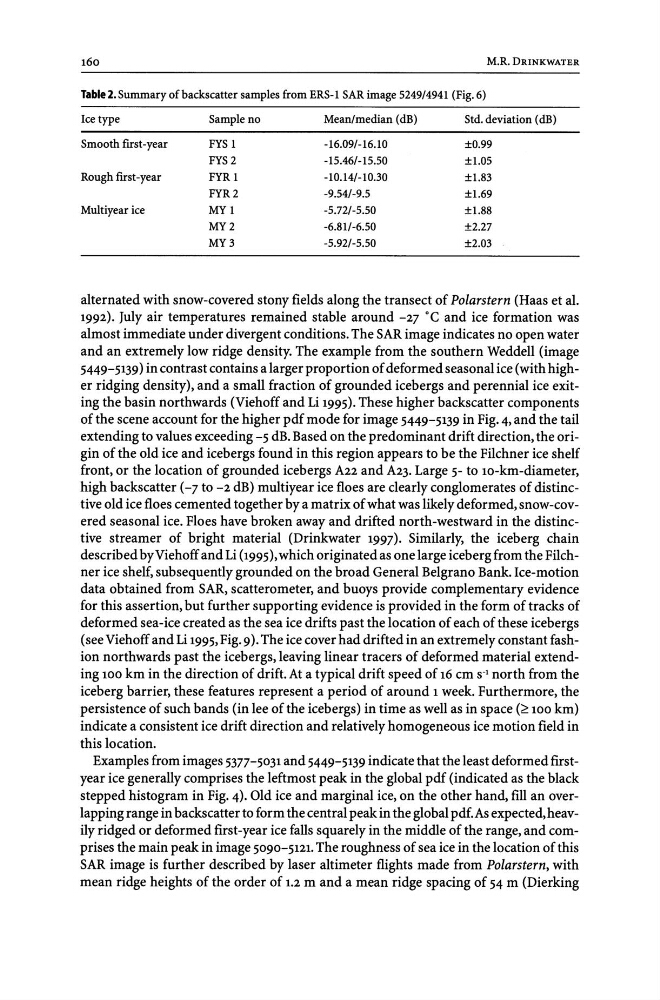
Table 2. Summary of backscatter samples from ERS-1 SAR image 5249/4941 (Fig. 6)
Ice type
Sample no
Mean/median (dB)
Std. deviation (dB)
Smooth first-year
FYS 1
-16.09/-16.10
±0.99
FYS2
-15.46/-15.50
±1.05
Rough first-year
FYR 1
-10.14/-10.30
±1.83
FYR2
-9.54/-9.5
±1.69
Multiyear ice
MY1
-5.72/-5.50
±1.88
MY2
-6.81/-6.50
±2.27
MY3
-5.92/-5.50
±2.03
alternated with snow-covered stony fields along the transect of Polarstern (Haas et al.
1992). July air temperatures remained stable around -27 ·C and ice formation was
almost immediate under divergent conditions. The SAR image indicates no open water
and an extremely low ridge density. The example from the southern Weddell (image
5449-5139) in contrast contains a larger proportion of deformed seasonal ice (with higher ridging density), and a small fraction of grounded icebergs and perennial ice exiting the basin northwards (Viehoff and Li 1995). These higher backscatter components
of the scene account for the higher pdf mode for image 5449-5139 in Fig. 4, and the tail
extending to values exceeding -5 dB. Based on the predominant drift direction, the origin of the old ice and icebergs found in this region appears to be the FiIchner ice shelf
front, or the location of grounded icebergs A22 and A23. Large 5- to 10-km-diameter,
high backscatter (-7 to -2 dB) multiyear ice floes are clearly conglomerates of distinctive old ice floes cemented together by a matrix of what was likely deformed, snow-covered seasonal ice. Floes have broken away and drifted north-westward in the distinctive streamer of bright material (Drinkwater 1997). Similarly, the iceberg chain
described byViehoff and Li (1995), which originated as one large iceberg from the FiIchner ice shelf, subsequently grounded on the broad General Belgrano Bank. Ice-motion
data obtained from SAR, scatterometer, and buoys provide complementary evidence
for this assertion, but further supporting evidence is provided in the form of tracks of
deformed sea-ice created as the sea ice drifts past the location of each of these icebergs
(see Viehoff and Li 1995, Fig. 9). The ice cover had drifted in an extremely constant fashion northwards past the icebergs, leaving linear tracers of deformed material extending 100 km in the direction of drift. At a typical drift speed of 16 cm S-1 north from the
iceberg barrier, these features represent a period of around 1 week. Furthermore, the
persistence of such bands (in lee of the icebergs) in time as well as in space (~100 km)
indicate a consistent ice drift direction and relatively homogeneous ice motion field in
this location.
Examples from images 5377-5031 and 5449-5139 indicate that the least deformed firstyear ice generally comprises the leftmost peak in the global pdf (indicated as the black
stepped histogram in Fig. 4). Old ice and marginal ice, on the other hand, fill an overlapping range in backscatter to form the central peak in the global pdf. As expected,heavily ridged or deformed first-year ice falls squarely in the middle of the range, and comprises the main peak in image 5090-5121. The roughness of sea ice in the location of this
SAR image is further described by laser altimeter flights made from Polarstern, with
mean ridge heights of the order of 1.2 m and a mean ridge spacing of 54 m (Dierking
M.R. DRINKWATER
Table 2. Summary of backscatter samples from ERS-1 SAR image 5249/4941 (Fig. 6)
Ice type
Sample no
Mean/median (dB)
Std. deviation (dB)
Smooth first-year
FYS 1
-16.09/-16.10
±0.99
FYS2
-15.46/-15.50
±1.05
Rough first-year
FYR 1
-10.14/-10.30
±1.83
FYR2
-9.54/-9.5
±1.69
Multiyear ice
MY1
-5.72/-5.50
±1.88
MY2
-6.81/-6.50
±2.27
MY3
-5.92/-5.50
±2.03
alternated with snow-covered stony fields along the transect of Polarstern (Haas et al.
1992). July air temperatures remained stable around -27 ·C and ice formation was
almost immediate under divergent conditions. The SAR image indicates no open water
and an extremely low ridge density. The example from the southern Weddell (image
5449-5139) in contrast contains a larger proportion of deformed seasonal ice (with higher ridging density), and a small fraction of grounded icebergs and perennial ice exiting the basin northwards (Viehoff and Li 1995). These higher backscatter components
of the scene account for the higher pdf mode for image 5449-5139 in Fig. 4, and the tail
extending to values exceeding -5 dB. Based on the predominant drift direction, the origin of the old ice and icebergs found in this region appears to be the FiIchner ice shelf
front, or the location of grounded icebergs A22 and A23. Large 5- to 10-km-diameter,
high backscatter (-7 to -2 dB) multiyear ice floes are clearly conglomerates of distinctive old ice floes cemented together by a matrix of what was likely deformed, snow-covered seasonal ice. Floes have broken away and drifted north-westward in the distinctive streamer of bright material (Drinkwater 1997). Similarly, the iceberg chain
described byViehoff and Li (1995), which originated as one large iceberg from the FiIchner ice shelf, subsequently grounded on the broad General Belgrano Bank. Ice-motion
data obtained from SAR, scatterometer, and buoys provide complementary evidence
for this assertion, but further supporting evidence is provided in the form of tracks of
deformed sea-ice created as the sea ice drifts past the location of each of these icebergs
(see Viehoff and Li 1995, Fig. 9). The ice cover had drifted in an extremely constant fashion northwards past the icebergs, leaving linear tracers of deformed material extending 100 km in the direction of drift. At a typical drift speed of 16 cm S-1 north from the
iceberg barrier, these features represent a period of around 1 week. Furthermore, the
persistence of such bands (in lee of the icebergs) in time as well as in space (~100 km)
indicate a consistent ice drift direction and relatively homogeneous ice motion field in
this location.
Examples from images 5377-5031 and 5449-5139 indicate that the least deformed firstyear ice generally comprises the leftmost peak in the global pdf (indicated as the black
stepped histogram in Fig. 4). Old ice and marginal ice, on the other hand, fill an overlapping range in backscatter to form the central peak in the global pdf. As expected,heavily ridged or deformed first-year ice falls squarely in the middle of the range, and comprises the main peak in image 5090-5121. The roughness of sea ice in the location of this
SAR image is further described by laser altimeter flights made from Polarstern, with
mean ridge heights of the order of 1.2 m and a mean ridge spacing of 54 m (Dierking