

8 Satellite Microwave Radar Observations of Antarctic Sea Ice
159
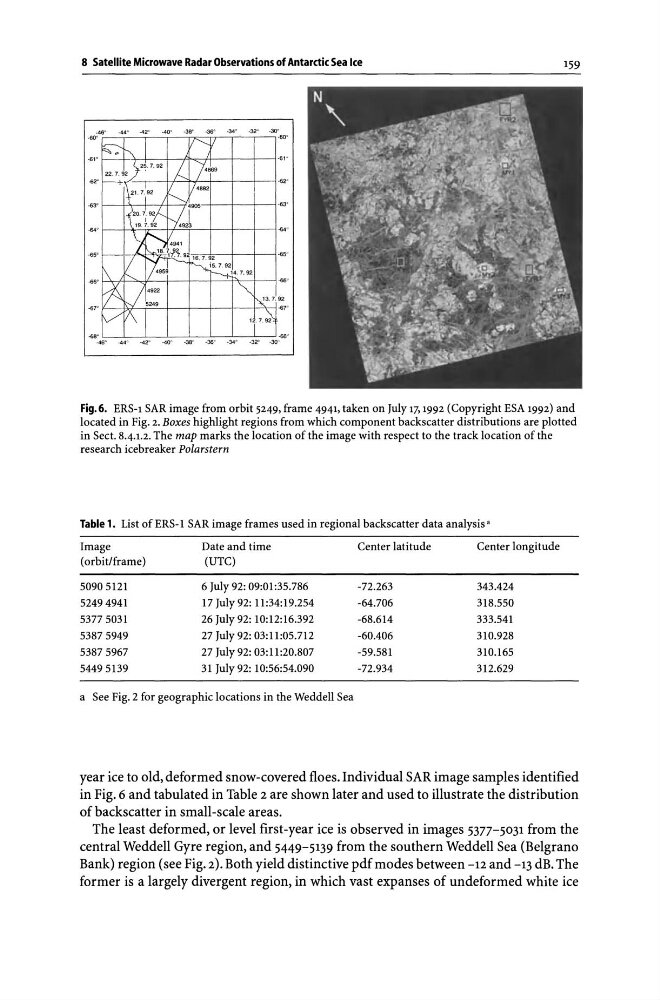
Fig.6. ERS-l SAR image from orbit 5249, frame 4941, taken on July 17, 1992 (Copyright ESA 1992) and
located in Fig. 2. Boxes highlight regions from which component backscatter distributions are plotted
in Sect. 8.4.1.2. The map marks the location of the image with respect to the track location of the
research icebreaker Polarstern
Table 1. List of ERS-1 SAR image frames used in regional backscatter data analysis'
Image
Date and time
Center latitude
Center longitude
(orbit/frame)
(UTC)
50905121
6 July 92: 09:01:35.786
-72.263
343.424
52494941
17 July 92: 11:34:19.254
-64.706
318.550
53775031
26 July 92: 10:12:16.392
-68.614
333.541
53875949
27 July 92: 03:11:05.712
-60.406
310.928
53875967
27 July 92: 03:11:20.807
-59.581
310.165
54495139
31 July 92: 10:56:54.090
-72.934
312.629
a See Fig. 2 for geographic locations in the Weddell Sea
year ice to old, deformed snow-covered floes. Individual SAR image samples identified
in Fig. 6 and tabulated in Table 2 are shown later and used to illustrate the distribution
of backscatter in small-scale areas.
The least deformed, or level first-year ice is observed in images 5377-5031 from the
central Weddell Gyre region, and 5449-5139 from the southern Weddell Sea (Belgrano
Bank) region (see Fig. 2). Both yield distinctive pdf modes between -12 and -13 dB. The
former is a largely divergent region, in which vast expanses of undeformed white ice
159
Fig.6. ERS-l SAR image from orbit 5249, frame 4941, taken on July 17, 1992 (Copyright ESA 1992) and
located in Fig. 2. Boxes highlight regions from which component backscatter distributions are plotted
in Sect. 8.4.1.2. The map marks the location of the image with respect to the track location of the
research icebreaker Polarstern
Table 1. List of ERS-1 SAR image frames used in regional backscatter data analysis'
Image
Date and time
Center latitude
Center longitude
(orbit/frame)
(UTC)
50905121
6 July 92: 09:01:35.786
-72.263
343.424
52494941
17 July 92: 11:34:19.254
-64.706
318.550
53775031
26 July 92: 10:12:16.392
-68.614
333.541
53875949
27 July 92: 03:11:05.712
-60.406
310.928
53875967
27 July 92: 03:11:20.807
-59.581
310.165
54495139
31 July 92: 10:56:54.090
-72.934
312.629
a See Fig. 2 for geographic locations in the Weddell Sea
year ice to old, deformed snow-covered floes. Individual SAR image samples identified
in Fig. 6 and tabulated in Table 2 are shown later and used to illustrate the distribution
of backscatter in small-scale areas.
The least deformed, or level first-year ice is observed in images 5377-5031 from the
central Weddell Gyre region, and 5449-5139 from the southern Weddell Sea (Belgrano
Bank) region (see Fig. 2). Both yield distinctive pdf modes between -12 and -13 dB. The
former is a largely divergent region, in which vast expanses of undeformed white ice