

8 Satellite Microwave Radar Observations of Antarctic Sea Ice
161
1995). Therefore, for the central ice pack, linear mixing of the two end members (1)
smooth un deformed ice and (2) thick perennial ice accounts for a continuum of oOSAR
values between -19 and -4 dB. Except for the confusion existing between multiyear ice
and MIZ signatures, the value of SAR backscatter appears closely related to the amount
of deformation and ridging density of the ice, or broadly speaking, ice thickness.
Although backscatter values may be encountered in the range -20 to -25 dB, for newly
growing areas of nilas and gray ice (in leads or ice shelf polynya systems), large expanses of such low-backscatter material are rarely encountered in the Weddell Sea.
8.4.1.3
Snapshot Signature Summary
The SAR image example shown in Fig. 6, provides the largest mixture of ice ages and
snow depths, due to its prime location in the perennial ice outflow region (Drinkwater
1997). The corresponding pdffor frame 5249-4941 in Fig. 4 confirms a broad peak comprising a variety of pixels spanning the range of possible white, first-year, and multiyear ice oOSAR values. A number of samples are extracted from this image to generate
Table 2. Values describe the signatures of the primary ice components, each of which is
extracted on the basis of the scattering characteristics and of their homogeneity.
Smooth and rough first-year and multiyear ice mean oOSAR values range from -16.1 dB
to -5.5 dB. In total, a further 60 samples (each of 100 or more pixels) were collected in
the same manner from the bold SAR images shown in Fig. 2, to generate a summary of
snapshot winter backscatter characteristics of these primary ice types. All except the
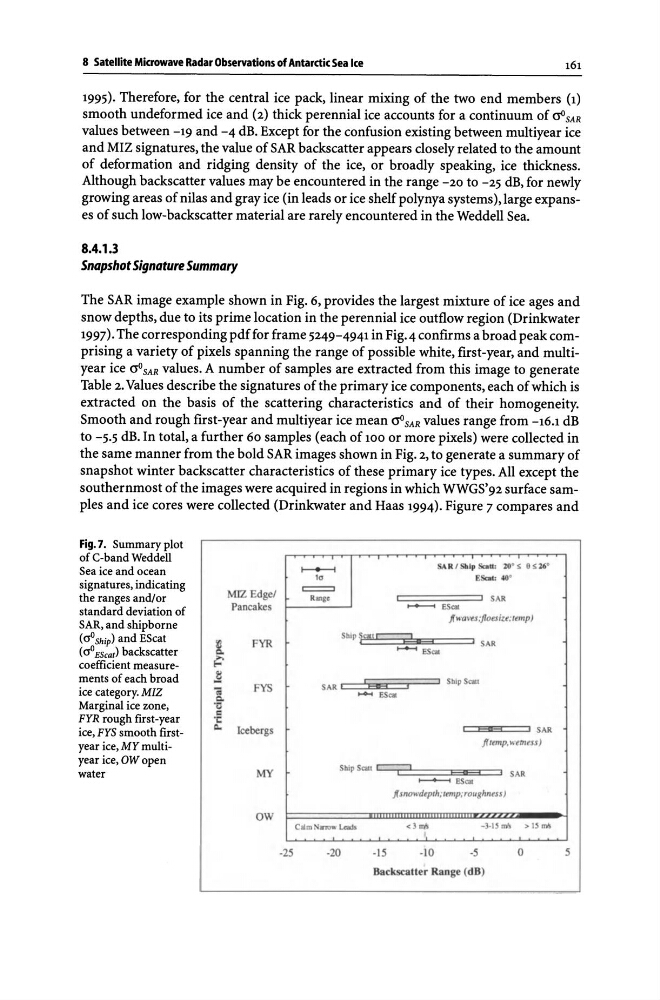
southernmost of the images were acquired in regions in which WWGS' 92 surface samples and ice cores were collected (Drinkwater and Haas 1994). Figure 7 compares and
Fig. 7. Summary plot
of C-band Weddell
Sea ice and ocean
signatures, indicating
the ranges and/or
standard deviation of
SAR, and shipborne
(cfl Ship) and EScat
(0'0 EScat) backscatter
coefficient measurements of each broad
ice category. MIZ
Marginal ice zone,
FYR rough first-year
ice, FYS smooth firstyear ice, MY multiyear ice, OW open
water
MIZ Edge!
Pancakes
FYR
FYS
Icebergs
MY
ow
-25
SAR I Sblp Salu! %0° S e s: u ·
Es...,4O"
C:::==::==:J 1 S~R
-
ESCII
j(M"Q\o't'.s;jloesiz.t;ltmpJ
StuPjcal ~
I AR
........... ESCII
SAR f
I Hf3
hip SC*t
........ ESat
=31:3:::=' SAR
ft rtmp, wtm .. s)
Ship Sc ... =7'~""C:==:::::E'!3E3:=' S~R
............... ESao
jfsnoM'dtprh;rtmp; roushntss)
-20
-15
-10
-5
o
Backscatter Range (dB)
5
161
1995). Therefore, for the central ice pack, linear mixing of the two end members (1)
smooth un deformed ice and (2) thick perennial ice accounts for a continuum of oOSAR
values between -19 and -4 dB. Except for the confusion existing between multiyear ice
and MIZ signatures, the value of SAR backscatter appears closely related to the amount
of deformation and ridging density of the ice, or broadly speaking, ice thickness.
Although backscatter values may be encountered in the range -20 to -25 dB, for newly
growing areas of nilas and gray ice (in leads or ice shelf polynya systems), large expanses of such low-backscatter material are rarely encountered in the Weddell Sea.
8.4.1.3
Snapshot Signature Summary
The SAR image example shown in Fig. 6, provides the largest mixture of ice ages and
snow depths, due to its prime location in the perennial ice outflow region (Drinkwater
1997). The corresponding pdffor frame 5249-4941 in Fig. 4 confirms a broad peak comprising a variety of pixels spanning the range of possible white, first-year, and multiyear ice oOSAR values. A number of samples are extracted from this image to generate
Table 2. Values describe the signatures of the primary ice components, each of which is
extracted on the basis of the scattering characteristics and of their homogeneity.
Smooth and rough first-year and multiyear ice mean oOSAR values range from -16.1 dB
to -5.5 dB. In total, a further 60 samples (each of 100 or more pixels) were collected in
the same manner from the bold SAR images shown in Fig. 2, to generate a summary of
snapshot winter backscatter characteristics of these primary ice types. All except the
southernmost of the images were acquired in regions in which WWGS' 92 surface samples and ice cores were collected (Drinkwater and Haas 1994). Figure 7 compares and
Fig. 7. Summary plot
of C-band Weddell
Sea ice and ocean
signatures, indicating
the ranges and/or
standard deviation of
SAR, and shipborne
(cfl Ship) and EScat
(0'0 EScat) backscatter
coefficient measurements of each broad
ice category. MIZ
Marginal ice zone,
FYR rough first-year
ice, FYS smooth firstyear ice, MY multiyear ice, OW open
water
MIZ Edge!
Pancakes
FYR
FYS
Icebergs
MY
ow
-25
SAR I Sblp Salu! %0° S e s: u ·
Es...,4O"
C:::==::==:J 1 S~R
-
ESCII
j(M"Q\o't'.s;jloesiz.t;ltmpJ
StuPjcal ~
I AR
........... ESCII
SAR f
I Hf3
hip SC*t
........ ESat
=31:3:::=' SAR
ft rtmp, wtm .. s)
Ship Sc ... =7'~""C:==:::::E'!3E3:=' S~R
............... ESao
jfsnoM'dtprh;rtmp; roushntss)
-20
-15
-10
-5
o
Backscatter Range (dB)
5