

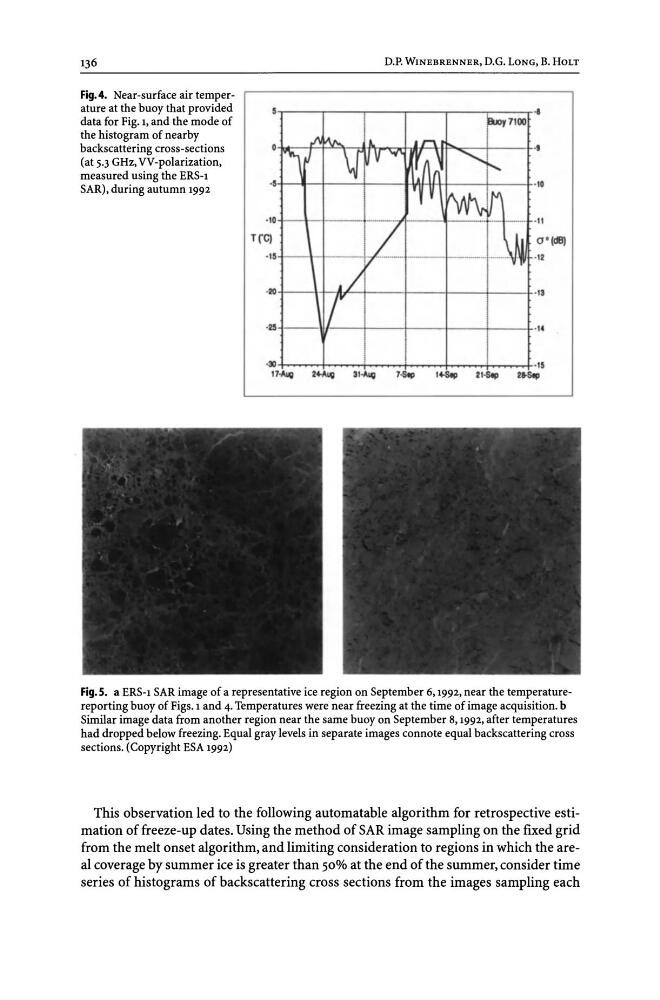
Fig.4. Near-surface air temperature at the buoy that provided
data for Fig. 1, and the mode of
the histogram of nearby
backscattering cross-sections
(at 5.3 GHz, VV-polarization,
measured using the ERS-l
SAR), during autumn 1992
D.P. WINEBRENNER, D.G. LONG, B. HOLT
..---r--~---'---"----'--""T"
ou::--++'9:-.:tf'h-'OOrhitl--+IIF"''''c-+---+·'
·'+-~I-+---+----I-1"'l-tH+---+---+· '0
·10
TrC)
·15
·11
a'(~
·12
·20+-- --l+.tI'-+--+---+---+---+.,'
11/ ---+---+---+---+---+" 4
Fig. S. a ERS-l SAR image of a representative ice region on September 6, 1992, near the temperaturereporting buoy of Figs. 1 and 4. Temperatures were near freezing at the time of image acquisition. b
Similar image data from another region near the same buoy on September 8, 1992, after temperatures
had dropped below freezing. Equal gray levels in separate images connote equal backscattering cross
sections. (Copyright ESA 1992)
This observation led to the following automatable algorithm for retrospective estimation of freeze-up dates. Using the method of SAR image sampling on the fixed grid
from the melt onset algorithm, and limiting consideration to regions in which the areal coverage by summer ice is greater than 50% at the end of the summer, consider time
series of histograms of backscattering cross sections from the images sampling each
data for Fig. 1, and the mode of
the histogram of nearby
backscattering cross-sections
(at 5.3 GHz, VV-polarization,
measured using the ERS-l
SAR), during autumn 1992
D.P. WINEBRENNER, D.G. LONG, B. HOLT
..---r--~---'---"----'--""T"
ou::--++'9:-.:tf'h-'OOrhitl--+IIF"''''c-+---+·'
·'+-~I-+---+----I-1"'l-tH+---+---+· '0
·10
TrC)
·15
·11
a'(~
·12
·20+-- --l+.tI'-+--+---+---+---+.,'
11/ ---+---+---+---+---+" 4
Fig. S. a ERS-l SAR image of a representative ice region on September 6, 1992, near the temperaturereporting buoy of Figs. 1 and 4. Temperatures were near freezing at the time of image acquisition. b
Similar image data from another region near the same buoy on September 8, 1992, after temperatures
had dropped below freezing. Equal gray levels in separate images connote equal backscattering cross
sections. (Copyright ESA 1992)
This observation led to the following automatable algorithm for retrospective estimation of freeze-up dates. Using the method of SAR image sampling on the fixed grid
from the melt onset algorithm, and limiting consideration to regions in which the areal coverage by summer ice is greater than 50% at the end of the summer, consider time
series of histograms of backscattering cross sections from the images sampling each