

7 Mapping the Progression of Melt Onset and Freeze-Up
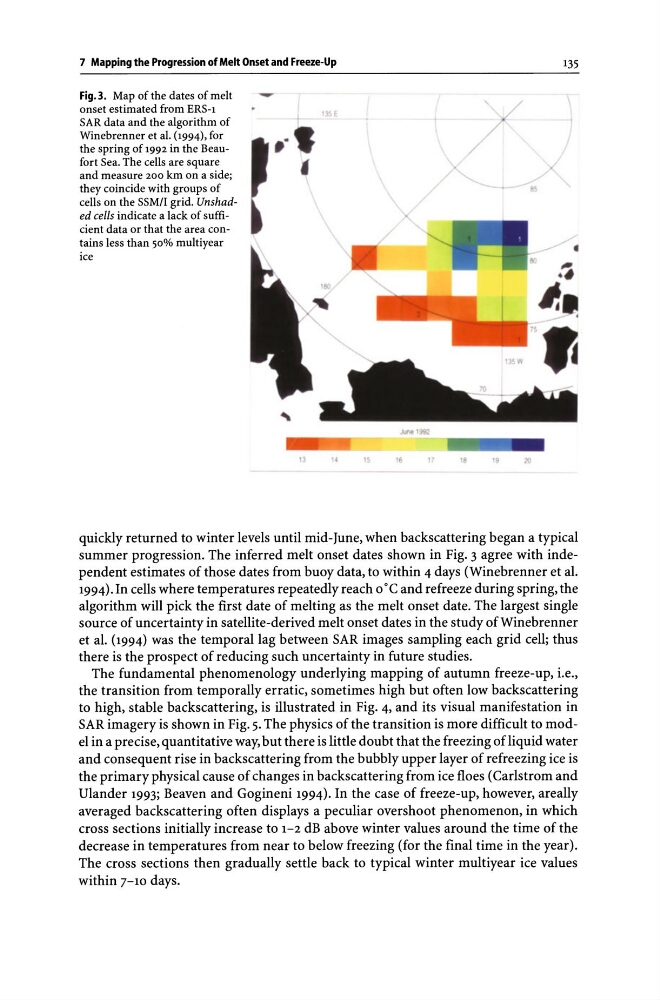
Fig_ 3. Map of the dates of melt
-
onset estimated from ERS-l
SAR data and the algorithm of
Winebrenner et aJ. (1994), for
the spring of 1992 in the Beaufort Sea. The cells are square
and measure 200 km on a side;
they coincide with groups of
cells on the SSM/I grid. Unshaded cells indicate a lack of sufficient data or that the area contains less than 50% multiyear
ice
135
"
20
quickly returned to winter levels until mid-June, when backscattering began a typical
summer progression. The inferred melt onset dates shown in Fig. 3 agree with independent estimates of those dates from buoy data, to within 4 days (Winebrenner et al.
1994). In cells where temperatures repeatedly reach o·C and refreeze during spring, the
algorithm will pick the first date of melting as the melt onset date. The largest single
source of uncertainty in satellite-derived melt onset dates in the study of Winebrenner
et al. (1994) was the temporal lag between SAR images sampling each grid cell; thus
there is the prospect of reducing such uncertainty in future studies.
The fundamental phenomenology underlying mapping of autumn freeze-up, i.e.,
the transition from temporally erratic, sometimes high but often low backscattering
to high, stable backscattering, is illustrated in Fig. 4, and its visual manifestation in
SAR imagery is shown in Fig. 5. The physics of the transition is more difficult to model in a precise, quantitative way, but there is little doubt that the freezing of liquid water
and consequent rise in backscattering from the bubbly upper layer of refreezing ice is
the primary physical cause of changes in backscattering from ice floes (Carlstrom and
Ulander 1993; Beaven and Gogineni 1994). In the case of freeze-up, however, areally
averaged backscattering often displays a peculiar overshoot phenomenon, in which
cross sections initially increase to 1-2 dB above winter values around the time of the
decrease in temperatures from near to below freezing (for the final time in the year).
The cross sections then gradually settle back to typical winter multiyear ice values
within 7-10 days.
Fig_ 3. Map of the dates of melt
-
onset estimated from ERS-l
SAR data and the algorithm of
Winebrenner et aJ. (1994), for
the spring of 1992 in the Beaufort Sea. The cells are square
and measure 200 km on a side;
they coincide with groups of
cells on the SSM/I grid. Unshaded cells indicate a lack of sufficient data or that the area contains less than 50% multiyear
ice
135
"
20
quickly returned to winter levels until mid-June, when backscattering began a typical
summer progression. The inferred melt onset dates shown in Fig. 3 agree with independent estimates of those dates from buoy data, to within 4 days (Winebrenner et al.
1994). In cells where temperatures repeatedly reach o·C and refreeze during spring, the
algorithm will pick the first date of melting as the melt onset date. The largest single
source of uncertainty in satellite-derived melt onset dates in the study of Winebrenner
et al. (1994) was the temporal lag between SAR images sampling each grid cell; thus
there is the prospect of reducing such uncertainty in future studies.
The fundamental phenomenology underlying mapping of autumn freeze-up, i.e.,
the transition from temporally erratic, sometimes high but often low backscattering
to high, stable backscattering, is illustrated in Fig. 4, and its visual manifestation in
SAR imagery is shown in Fig. 5. The physics of the transition is more difficult to model in a precise, quantitative way, but there is little doubt that the freezing of liquid water
and consequent rise in backscattering from the bubbly upper layer of refreezing ice is
the primary physical cause of changes in backscattering from ice floes (Carlstrom and
Ulander 1993; Beaven and Gogineni 1994). In the case of freeze-up, however, areally
averaged backscattering often displays a peculiar overshoot phenomenon, in which
cross sections initially increase to 1-2 dB above winter values around the time of the
decrease in temperatures from near to below freezing (for the final time in the year).
The cross sections then gradually settle back to typical winter multiyear ice values
within 7-10 days.