

S Fusion of Satellite SAR with Passive Microwave Data for Sea Ice Remote Sensing
105
For the region observed in SAR frame 1719, the ice observations logged during the
lAOE field experiment aboard the Polar Star were used to compute average multiyear
and average first-year/new ice concentrations for this region. The ice observations were
obtained in this region over a period of 3 days from Julian day 243 to Julian day 245. The
average ship-based estimate for multiyear ice concentration for this region was 70% and
the first-year plus new ice concentration was about 14%, for a total ice concentration of
approximately 84%. The ice observations for the young ice categories were approximately 10%. The hybrid fusion estimates for the frame 1719 region yield multiyear ice
concentrations of 62 and 64% and first-year ice concentrations ofl4.5 and 18.7%. Using
the NT algorithm, the multiyear and first-year ice concentration ranges were 39-52%
and 27-40%, respectively. The hybrid fusion estimates are much closer to the ship-based
estimates from this region than the ice concentrations obtained using the NT algorithm.
The multiyear ice concentration results are also consistent with the 60 to 70% multiyear
ice concentration obtained by using new sets of pure ice type signatures in the NT algorithm (Thomas and Rothrock 1993). Our results demonstrate that fusion ofSAR and passive microwave data can improve estimates of ice type concentration in the fall season.
5.6
Discussion and Future Direction
During the initial portion of the freeze-up season, any accurate first-year ice concentration should include thin and young first-year ice in the 10-50 cm range of thickness.
Published measurements suggest that the passive microwave signature of thin ice
approaches the first-year ice tie point in the NT algorithm as it grows to a thickness of
approximately 10 cm (Wensnahan et al. 1993). Therefore, the first-year ice concentration estimates obtained using our hybrid fusion technique include new first-year ice
during this time of the year. The mean signatures of these subclasses of first-year ice
are described below. This is followed by discussion of the effect of the error in first-year
ice concentration on derived heat flux estimates.
Widespread initiation of sea ice growth occurs during the freeze-up season in the Arctic.
Thin sea ice, in the form of frazil, dark nilas, and light nilas, was observed in concentrations
of up to 5% during the lAOE experiment. The passive microwave signature of new sea ice
experiences rapid changes in the initial growth phase. Based on laboratory measurements
of thin ice grown at the US Army Cold Regions Research Laboratory (CRREL), these changes
in emissivity may be caused by salinity enhancement of the ice surface (Wensnahan et al.
1993). The evolution of passive microwave signatures of thin ice appears to be rapid in the
initial growth phase and approaches the first-year ice signature as ice thickness reaches
approximately 10 cm. Beyond the initial stages of growth, the passive microwave signatures
of young first-year ice gradually evolve towards the first -year ice signature (Eppler et al.1992).
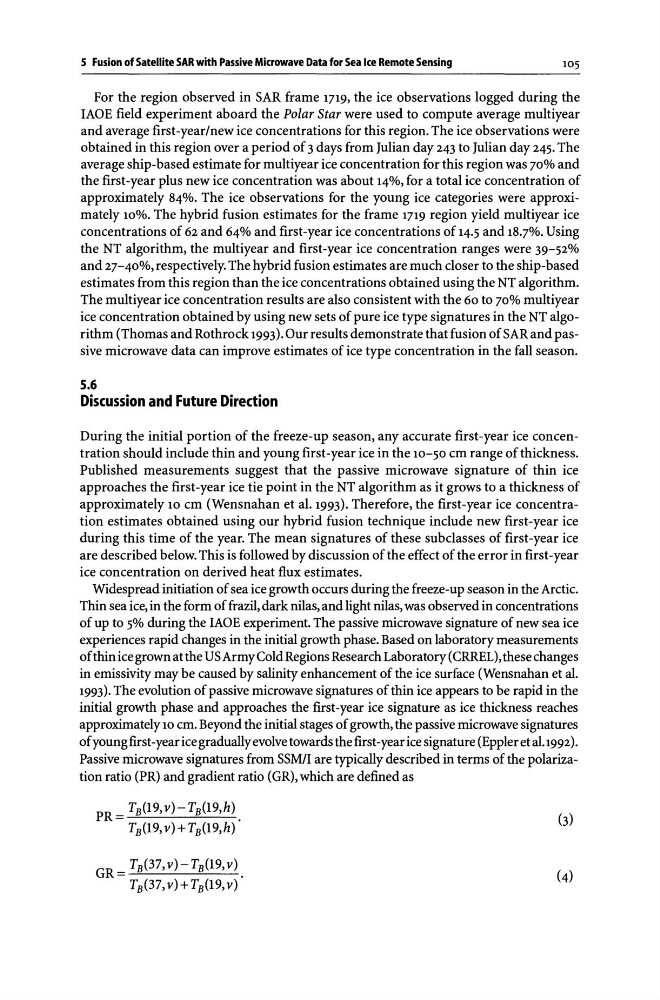
Passive microwave signatures from SSM/l are typically described in terms of the polarization ratio (PR) and gradient ratio (GR), which are defined as
PR= TB(l9,v)-TB(l9,h).
TB (1 9, v)+ T B (l9,h)
GR= TB(37,v)-TB(l9,v).
T B (37, v)+ T B (l9, v)
105
For the region observed in SAR frame 1719, the ice observations logged during the
lAOE field experiment aboard the Polar Star were used to compute average multiyear
and average first-year/new ice concentrations for this region. The ice observations were
obtained in this region over a period of 3 days from Julian day 243 to Julian day 245. The
average ship-based estimate for multiyear ice concentration for this region was 70% and
the first-year plus new ice concentration was about 14%, for a total ice concentration of
approximately 84%. The ice observations for the young ice categories were approximately 10%. The hybrid fusion estimates for the frame 1719 region yield multiyear ice
concentrations of 62 and 64% and first-year ice concentrations ofl4.5 and 18.7%. Using
the NT algorithm, the multiyear and first-year ice concentration ranges were 39-52%
and 27-40%, respectively. The hybrid fusion estimates are much closer to the ship-based
estimates from this region than the ice concentrations obtained using the NT algorithm.
The multiyear ice concentration results are also consistent with the 60 to 70% multiyear
ice concentration obtained by using new sets of pure ice type signatures in the NT algorithm (Thomas and Rothrock 1993). Our results demonstrate that fusion ofSAR and passive microwave data can improve estimates of ice type concentration in the fall season.
5.6
Discussion and Future Direction
During the initial portion of the freeze-up season, any accurate first-year ice concentration should include thin and young first-year ice in the 10-50 cm range of thickness.
Published measurements suggest that the passive microwave signature of thin ice
approaches the first-year ice tie point in the NT algorithm as it grows to a thickness of
approximately 10 cm (Wensnahan et al. 1993). Therefore, the first-year ice concentration estimates obtained using our hybrid fusion technique include new first-year ice
during this time of the year. The mean signatures of these subclasses of first-year ice
are described below. This is followed by discussion of the effect of the error in first-year
ice concentration on derived heat flux estimates.
Widespread initiation of sea ice growth occurs during the freeze-up season in the Arctic.
Thin sea ice, in the form of frazil, dark nilas, and light nilas, was observed in concentrations
of up to 5% during the lAOE experiment. The passive microwave signature of new sea ice
experiences rapid changes in the initial growth phase. Based on laboratory measurements
of thin ice grown at the US Army Cold Regions Research Laboratory (CRREL), these changes
in emissivity may be caused by salinity enhancement of the ice surface (Wensnahan et al.
1993). The evolution of passive microwave signatures of thin ice appears to be rapid in the
initial growth phase and approaches the first-year ice signature as ice thickness reaches
approximately 10 cm. Beyond the initial stages of growth, the passive microwave signatures
of young first-year ice gradually evolve towards the first -year ice signature (Eppler et al.1992).
Passive microwave signatures from SSM/l are typically described in terms of the polarization ratio (PR) and gradient ratio (GR), which are defined as
PR= TB(l9,v)-TB(l9,h).
TB (1 9, v)+ T B (l9,h)
GR= TB(37,v)-TB(l9,v).
T B (37, v)+ T B (l9, v)