

104
S.G. BEAVEN AND S.P. GOGINENI
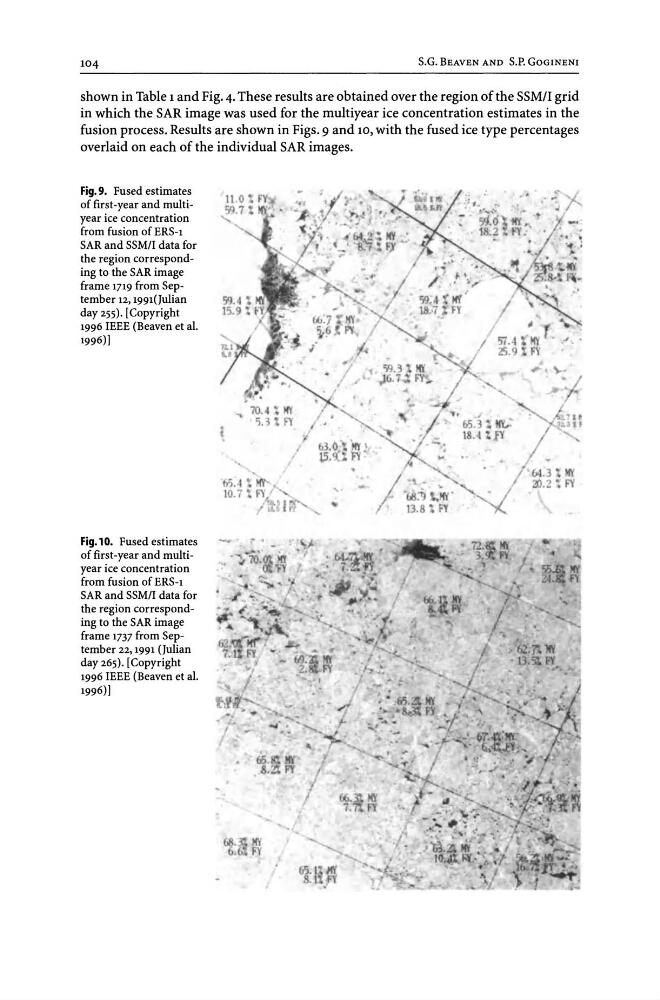
shown in Table 1 and Fig. 4. These results are obtained over the region of the SSM/I grid
in which the SAR image was used for the multiyear ice concentration estimates in the
fusion process. Results are shown in Figs. 9 and lO, with the fused ice type percentages
overlaid on each of the individual SAR images.
Fig. 9. Fused estimates
of first-year and multiyear ice concentration
from fusion ofERS-l
SAR and SSM/I data for
the region corresponding to the SAR image
frame 1719 from September 12, 1991(Julian
day 255). [Copyright
1996 IEEE (Beaven et al.
1996)]
Fig. 10. Fused estimates
of first-year and multiyear ice concentration
from fusion of ERS-l
SAR and SSM/I data for
the region corresponding to the SAR image
frame 1737 from September 22, 1991 (Julian
day 265). [Copyright
1996 IEEE (Beaven et al.
1996)]
S.G. BEAVEN AND S.P. GOGINENI
shown in Table 1 and Fig. 4. These results are obtained over the region of the SSM/I grid
in which the SAR image was used for the multiyear ice concentration estimates in the
fusion process. Results are shown in Figs. 9 and lO, with the fused ice type percentages
overlaid on each of the individual SAR images.
Fig. 9. Fused estimates
of first-year and multiyear ice concentration
from fusion ofERS-l
SAR and SSM/I data for
the region corresponding to the SAR image
frame 1719 from September 12, 1991(Julian
day 255). [Copyright
1996 IEEE (Beaven et al.
1996)]
Fig. 10. Fused estimates
of first-year and multiyear ice concentration
from fusion of ERS-l
SAR and SSM/I data for
the region corresponding to the SAR image
frame 1737 from September 22, 1991 (Julian
day 265). [Copyright
1996 IEEE (Beaven et al.
1996)]