

S Fusion of Satellite SAR with Passive Microwave Data for Sea Ice Remote Sensing
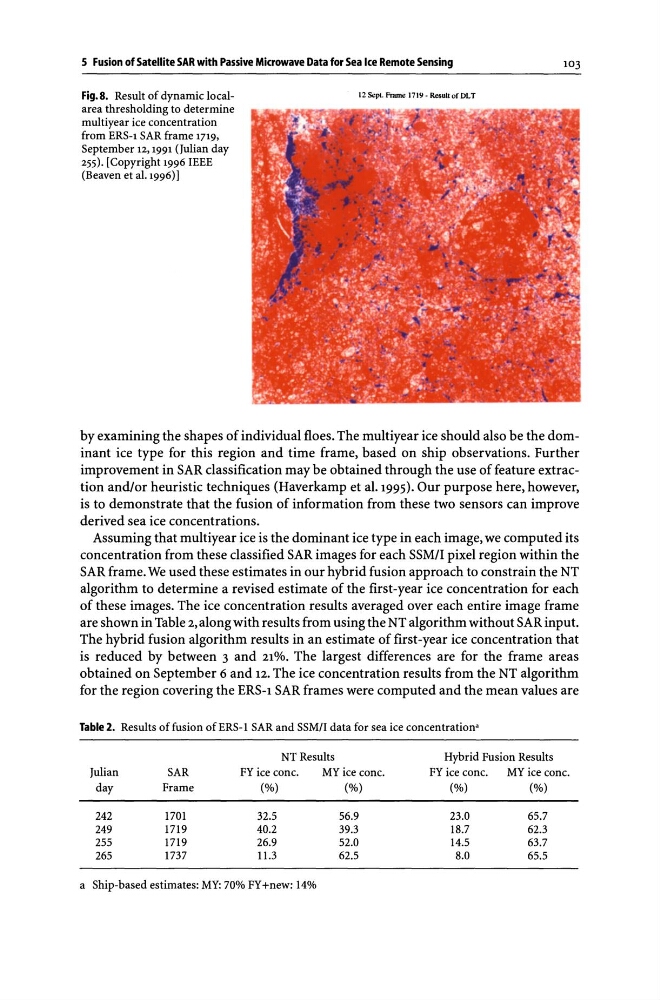
Fig. 8. Result of dynamic localarea thresholding to determine
multiyear ice concentration
from ERS-1 SAR frame 1719,
September 12,1991 (Julian day
255). [Copyright 1996 IEEE
(Beaven et al. 1996) 1
12 Sept. Frame 1719· Result of DLT
103
by examining the shapes of individual floes. The multiyear ice should also be the dominant ice type for this region and time frame, based on ship observations. Further
improvement in SAR classification may be obtained through the use of feature extraction and!or heuristic techniques (Haverkamp et al.1995). Our purpose here, however,
is to demonstrate that the fusion of information from these two sensors can improve
derived sea ice concentrations.
Assuming that multiyear ice is the dominant ice type in each image, we computed its
concentration from these classified SAR images for each SSM!! pixel region within the
SAR frame. We used these estimates in our hybrid fusion approach to constrain the NT
algorithm to determine a revised estimate of the first-year ice concentration for each
of these images. The ice concentration results averaged over each entire image frame
are shown in Table 2, along with results from using the NT algorithm without SAR input.
The hybrid fusion algorithm results in an estimate of first-year ice concentration that
is reduced by between 3 and 21%. The largest differences are for the frame areas
obtained on September 6 and 12. The ice concentration results from the NT algorithm
for the region covering the ERS-1 SAR frames were computed and the mean values are
Table 2. Results offusion of ERS-l SAR and SSM!! data for sea ice concentration"
NT Results
Julian
SAR
FY ice conc.
MY ice cone.
day
Frame
(%)
(%)
242
1701
32.5
56.9
249
1719
40.2
39.3
255
1719
26.9
52.0
265
1737
11.3
62.5
a Ship-based estimates: MY: 70% FY +new: 14%
Hybrid Fusion Results
FY ice conc.
MY ice conc.
(%)
(%)
23.0
18.7
14.5
8.0
65.7
62.3
63.7
65.5
Fig. 8. Result of dynamic localarea thresholding to determine
multiyear ice concentration
from ERS-1 SAR frame 1719,
September 12,1991 (Julian day
255). [Copyright 1996 IEEE
(Beaven et al. 1996) 1
12 Sept. Frame 1719· Result of DLT
103
by examining the shapes of individual floes. The multiyear ice should also be the dominant ice type for this region and time frame, based on ship observations. Further
improvement in SAR classification may be obtained through the use of feature extraction and!or heuristic techniques (Haverkamp et al.1995). Our purpose here, however,
is to demonstrate that the fusion of information from these two sensors can improve
derived sea ice concentrations.
Assuming that multiyear ice is the dominant ice type in each image, we computed its
concentration from these classified SAR images for each SSM!! pixel region within the
SAR frame. We used these estimates in our hybrid fusion approach to constrain the NT
algorithm to determine a revised estimate of the first-year ice concentration for each
of these images. The ice concentration results averaged over each entire image frame
are shown in Table 2, along with results from using the NT algorithm without SAR input.
The hybrid fusion algorithm results in an estimate of first-year ice concentration that
is reduced by between 3 and 21%. The largest differences are for the frame areas
obtained on September 6 and 12. The ice concentration results from the NT algorithm
for the region covering the ERS-1 SAR frames were computed and the mean values are
Table 2. Results offusion of ERS-l SAR and SSM!! data for sea ice concentration"
NT Results
Julian
SAR
FY ice conc.
MY ice cone.
day
Frame
(%)
(%)
242
1701
32.5
56.9
249
1719
40.2
39.3
255
1719
26.9
52.0
265
1737
11.3
62.5
a Ship-based estimates: MY: 70% FY +new: 14%
Hybrid Fusion Results
FY ice conc.
MY ice conc.
(%)
(%)
23.0
18.7
14.5
8.0
65.7
62.3
63.7
65.5