

3.6 Comparison of Results of Numerical Wave Propagation Schemes
63
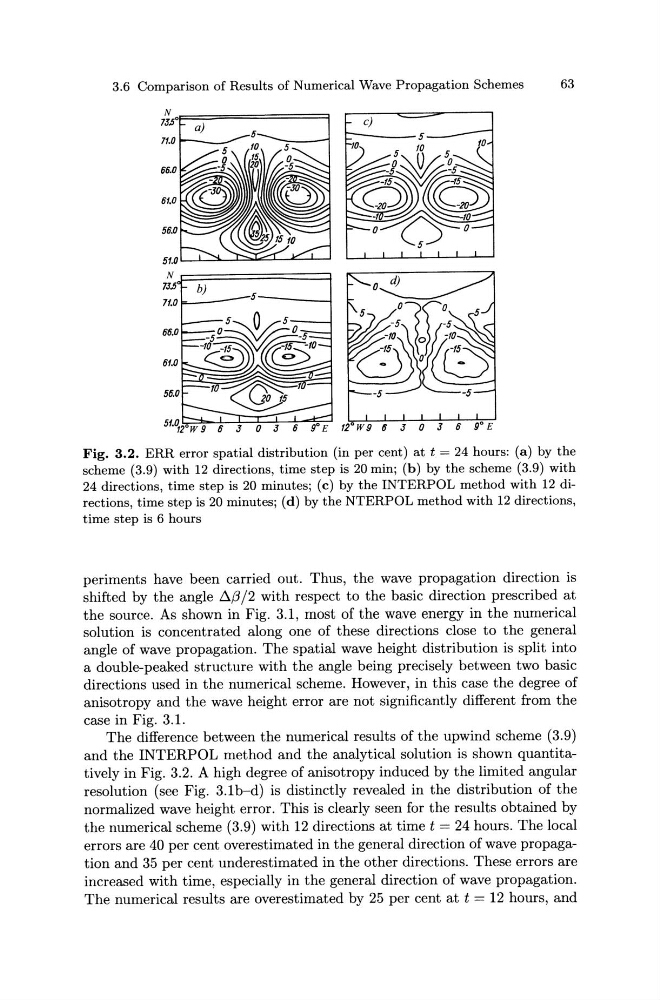
Fig. 3.2. ERR error spatial distribution (in per cent) at t = 24 hours: (a) by the
scheme (3.9) with 12 directions, time step is 20 min; (b) by the scheme (3.9) with
24 directions, time step is 20 minutes; (c) by the INTERPOL method with 12 directions, time step is 20 minutes; (d) by the NTERPOL method with 12 directions,
time step is 6 hours
periments have been carried out. Thus, the wave propagation direction is
shifted by the angle D../3/2 with respect to the basic direction prescribed at
the source. As shown in Fig. 3.1, most of the wave energy in the numerical
solution is concentrated along one of these directions close to the general
angle of wave propagation. The spatial wave height distribution is split into
a double-peaked structure with the angle being precisely between two basic
directions used in the numerical scheme. However, in this case the degree of
anisotropy and the wave height error are not significantly different from the
case in Fig. 3.1.
The difference between the numerical results of the upwind scheme (3.9)
and the INTERPOL method and the analytical solution is shown quantitatively in Fig. 3.2. A high degree of anisotropy induced by the limited angular
resolution (see Fig. 3.1b-d) is distinctly revealed in the distribution of the
normalized wave height error. This is clearly seen for the results obtained by
the numerical scheme (3.9) with 12 directions at timet= 24 hours. The local
errors are 40 per cent overestimated in the general direction of wave propagation and 35 per cent underestimated in the other directions. These errors are
increased with time, especially in the general direction of wave propagation.
The numerical results are overestimated by 25 per cent at t = 12 hours, and
63
Fig. 3.2. ERR error spatial distribution (in per cent) at t = 24 hours: (a) by the
scheme (3.9) with 12 directions, time step is 20 min; (b) by the scheme (3.9) with
24 directions, time step is 20 minutes; (c) by the INTERPOL method with 12 directions, time step is 20 minutes; (d) by the NTERPOL method with 12 directions,
time step is 6 hours
periments have been carried out. Thus, the wave propagation direction is
shifted by the angle D../3/2 with respect to the basic direction prescribed at
the source. As shown in Fig. 3.1, most of the wave energy in the numerical
solution is concentrated along one of these directions close to the general
angle of wave propagation. The spatial wave height distribution is split into
a double-peaked structure with the angle being precisely between two basic
directions used in the numerical scheme. However, in this case the degree of
anisotropy and the wave height error are not significantly different from the
case in Fig. 3.1.
The difference between the numerical results of the upwind scheme (3.9)
and the INTERPOL method and the analytical solution is shown quantitatively in Fig. 3.2. A high degree of anisotropy induced by the limited angular
resolution (see Fig. 3.1b-d) is distinctly revealed in the distribution of the
normalized wave height error. This is clearly seen for the results obtained by
the numerical scheme (3.9) with 12 directions at timet= 24 hours. The local
errors are 40 per cent overestimated in the general direction of wave propagation and 35 per cent underestimated in the other directions. These errors are
increased with time, especially in the general direction of wave propagation.
The numerical results are overestimated by 25 per cent at t = 12 hours, and