

6.6 Black Sea International Experiment
305
0.0 0.3 0.6 0.9 1.2 1.5 1.8 2.1 2.4 2.7 3.0 3.3 3.6 3.9 4.2 4.5 4.8 5.1 5.4
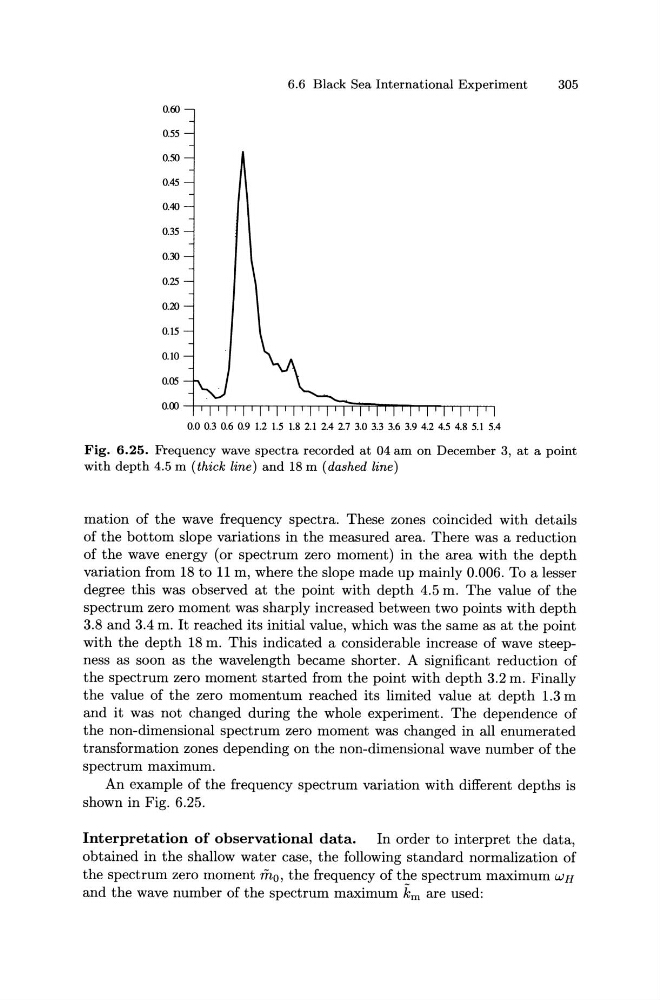
Fig. 6.25. Frequency wave spectra recorded at 04 am on December 3, at a point
with depth 4.5 m (thick line) and 18 m (dashed line)
mation of the wave frequency spectra. These zones coincided with details
of the bottom slope variations in the measured area. There was a reduction
of the wave energy (or spectrum zero moment) in the area with the depth
variation from 18 to 11 m, where the slope made up mainly 0.006. To a lesser
degree this was observed at the point with depth 4.5 m. The value of the
spectrum zero moment was sharply increased between two points with depth
3.8 and 3.4 m. It reached its initial value, which was the same as at the point
with the depth 18 m. This indicated a considerable increase of wave steepness as soon as the wavelength became shorter. A significant reduction of
the spectrum zero moment started from the point with depth 3.2 m. Finally
the value of the zero momentum reached its limited value at depth 1.3 m
and it was not changed during the whole experiment. The dependence of
the non-dimensional spectrum zero moment was changed in all enumerated
transformation zones depending on the non-dimensional wave number of the
spectrum maximum.
An example of the frequency spectrum variation with different depths is
shown in Fig. 6.25.
Interpretation of observational data. In order to interpret the data,
obtained in the shallow water case, the following standard normalization of
the spectrum zero moment m0 , the frequency of the spectrum maximum w H
and the wave number of the spectrum maximum km are used:
305
0.0 0.3 0.6 0.9 1.2 1.5 1.8 2.1 2.4 2.7 3.0 3.3 3.6 3.9 4.2 4.5 4.8 5.1 5.4
Fig. 6.25. Frequency wave spectra recorded at 04 am on December 3, at a point
with depth 4.5 m (thick line) and 18 m (dashed line)
mation of the wave frequency spectra. These zones coincided with details
of the bottom slope variations in the measured area. There was a reduction
of the wave energy (or spectrum zero moment) in the area with the depth
variation from 18 to 11 m, where the slope made up mainly 0.006. To a lesser
degree this was observed at the point with depth 4.5 m. The value of the
spectrum zero moment was sharply increased between two points with depth
3.8 and 3.4 m. It reached its initial value, which was the same as at the point
with the depth 18 m. This indicated a considerable increase of wave steepness as soon as the wavelength became shorter. A significant reduction of
the spectrum zero moment started from the point with depth 3.2 m. Finally
the value of the zero momentum reached its limited value at depth 1.3 m
and it was not changed during the whole experiment. The dependence of
the non-dimensional spectrum zero moment was changed in all enumerated
transformation zones depending on the non-dimensional wave number of the
spectrum maximum.
An example of the frequency spectrum variation with different depths is
shown in Fig. 6.25.
Interpretation of observational data. In order to interpret the data,
obtained in the shallow water case, the following standard normalization of
the spectrum zero moment m0 , the frequency of the spectrum maximum w H
and the wave number of the spectrum maximum km are used: