

6.6 Black Sea International Experiment
303
Distance from coastal line, m
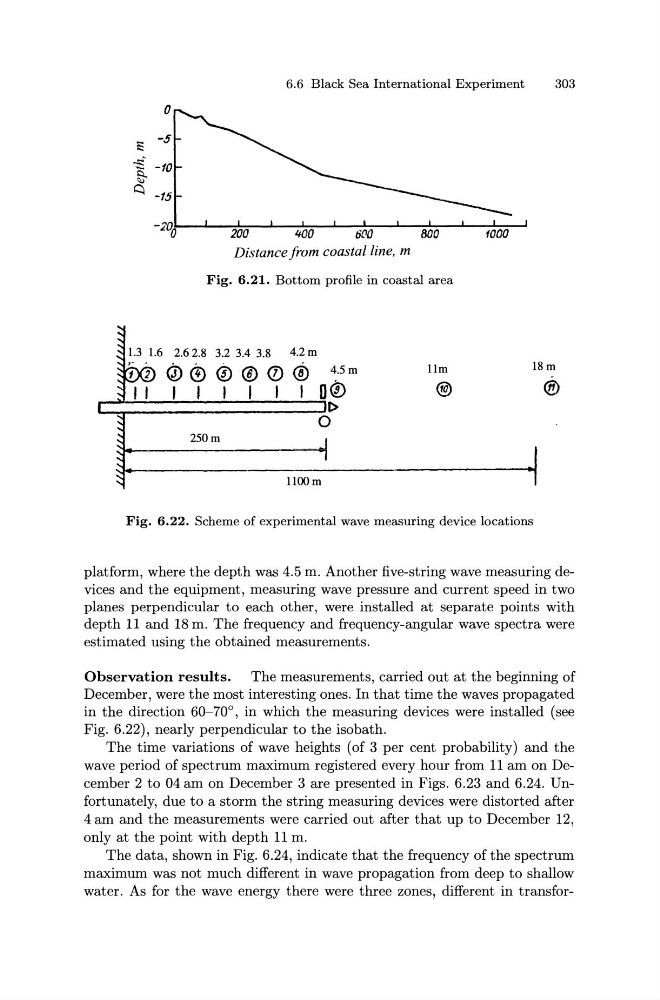
Fig. 6.21. Bottom profile in coastal area
3.2 3.4 3.8
4.2 m
Q) ® 0 ® Q) @ ~.5 m
I I I I I I 0®
~~------------------~~ 0
250m
..
llOOm
11m
@)
18m
®
·f
Fig. 6.22. Scheme of experimental wave measuring device locations
platform, where the depth was 4.5 m. Another five-string wave measuring devices and the equipment, measuring wave pressure and current speed in two
planes perpendicular to each other, were installed at separate points with
depth 11 and 18 m. The frequency and frequency-angular wave spectra were
estimated using the obtained measurements.
Observation results. The measurements, carried out at the beginning of
December, were the most interesting ones. In that time the waves propagated
in the direction 60-70°, in which the measuring devices were installed (see
Fig. 6.22), nearly perpendicular to the isobath.
The time variations of wave heights (of 3 per cent probability) and the
wave period of spectrum maximum registered every hour from 11 am on December 2 to 04 am on December 3 are presented in Figs. 6.23 and 6.24. Unfortunately, due to a storm the string measuring devices were distorted after
4 am and the measurements were carried out after that up to December 12,
only at the point with depth 11 m.
The data, shown in Fig. 6.24, indicate that the frequency of the spectrum
maximum was not much different in wave propagation from deep to shallow
water. As for the wave energy there were three zones, different in transfor-
303
Distance from coastal line, m
Fig. 6.21. Bottom profile in coastal area
3.2 3.4 3.8
4.2 m
Q) ® 0 ® Q) @ ~.5 m
I I I I I I 0®
~~------------------~~ 0
250m
..
llOOm
11m
@)
18m
®
·f
Fig. 6.22. Scheme of experimental wave measuring device locations
platform, where the depth was 4.5 m. Another five-string wave measuring devices and the equipment, measuring wave pressure and current speed in two
planes perpendicular to each other, were installed at separate points with
depth 11 and 18 m. The frequency and frequency-angular wave spectra were
estimated using the obtained measurements.
Observation results. The measurements, carried out at the beginning of
December, were the most interesting ones. In that time the waves propagated
in the direction 60-70°, in which the measuring devices were installed (see
Fig. 6.22), nearly perpendicular to the isobath.
The time variations of wave heights (of 3 per cent probability) and the
wave period of spectrum maximum registered every hour from 11 am on December 2 to 04 am on December 3 are presented in Figs. 6.23 and 6.24. Unfortunately, due to a storm the string measuring devices were distorted after
4 am and the measurements were carried out after that up to December 12,
only at the point with depth 11 m.
The data, shown in Fig. 6.24, indicate that the frequency of the spectrum
maximum was not much different in wave propagation from deep to shallow
water. As for the wave energy there were three zones, different in transfor-