

298
6 Wave Transformation in Shallow Water
S(k)/11-~, m rad· 1
0.8
0.8
0.4
0.2
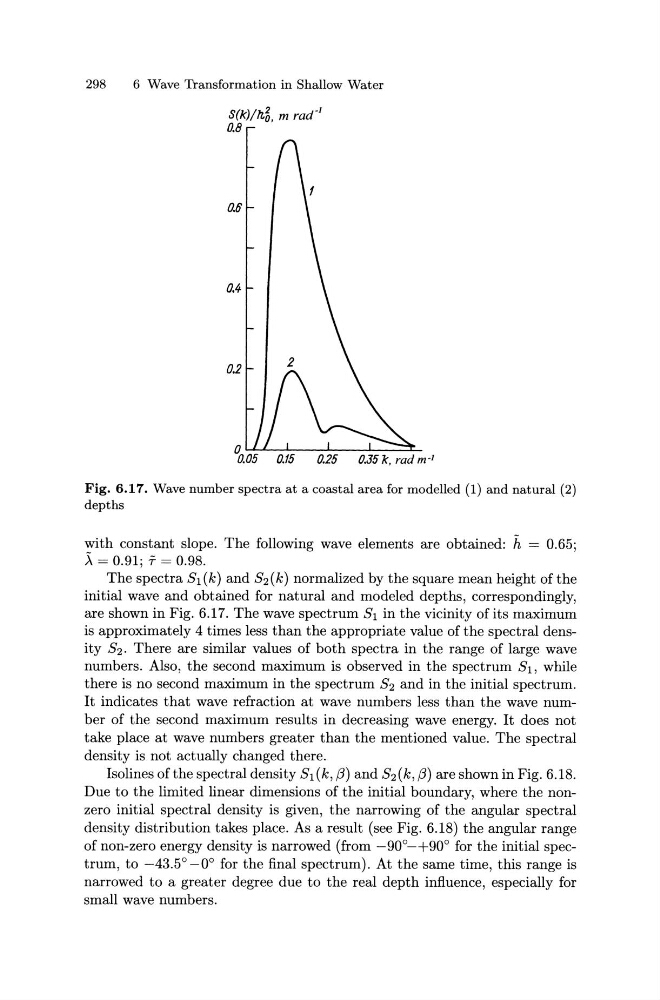
Fig. 6.17. Wave number spectra at a coastal area for modelled (1) and natural (2)
depths
with constant slope. The following wave elements are obtained: h = 0.65;
A= 0.91; T = 0.98.
The spectra S1 ( k) and S2 ( k) normalized by the square mean height of the
initial wave and obtained for natural and modeled depths, correspondingly,
are shown in Fig. 6.17. The wave spectrum S1 in the vicinity of its maximum
is approximately 4 times less than the appropriate value of the spectral density S2 . There are similar values of both spectra in the range of large wave
numbers. Also, the second maximum is observed in the spectrum S1 , while
there is no second maximum in the spectrum S2 and in the initial spectrum.
It indicates that wave refraction at wave numbers less than the wave number of the second maximum results in decreasing wave energy. It does not
take place at wave numbers greater than the mentioned value. The spectral
density is not actually changed there.
Isolines of the spectral density S 1 (k, {3) and S2 (k, {3) are shown in Fig. 6.18.
Due to the limited linear dimensions of the initial boundary, where the nonzero initial spectral density is given, the narrowing of the angular spectral
density distribution takes place. As a result (see Fig. 6.18) the angular range
of non-zero energy density is narrowed (from -90°-+90° for the initial spectrum, to -43.5°-0° for the final spectrum). At the same time, this range is
narrowed to a greater degree due to the real depth influence, especially for
small wave numbers.
6 Wave Transformation in Shallow Water
S(k)/11-~, m rad· 1
0.8
0.8
0.4
0.2
Fig. 6.17. Wave number spectra at a coastal area for modelled (1) and natural (2)
depths
with constant slope. The following wave elements are obtained: h = 0.65;
A= 0.91; T = 0.98.
The spectra S1 ( k) and S2 ( k) normalized by the square mean height of the
initial wave and obtained for natural and modeled depths, correspondingly,
are shown in Fig. 6.17. The wave spectrum S1 in the vicinity of its maximum
is approximately 4 times less than the appropriate value of the spectral density S2 . There are similar values of both spectra in the range of large wave
numbers. Also, the second maximum is observed in the spectrum S1 , while
there is no second maximum in the spectrum S2 and in the initial spectrum.
It indicates that wave refraction at wave numbers less than the wave number of the second maximum results in decreasing wave energy. It does not
take place at wave numbers greater than the mentioned value. The spectral
density is not actually changed there.
Isolines of the spectral density S 1 (k, {3) and S2 (k, {3) are shown in Fig. 6.18.
Due to the limited linear dimensions of the initial boundary, where the nonzero initial spectral density is given, the narrowing of the angular spectral
density distribution takes place. As a result (see Fig. 6.18) the angular range
of non-zero energy density is narrowed (from -90°-+90° for the initial spectrum, to -43.5°-0° for the final spectrum). At the same time, this range is
narrowed to a greater degree due to the real depth influence, especially for
small wave numbers.