

164
5 Wave Evolution in Non-uniform Currents in Deep Water
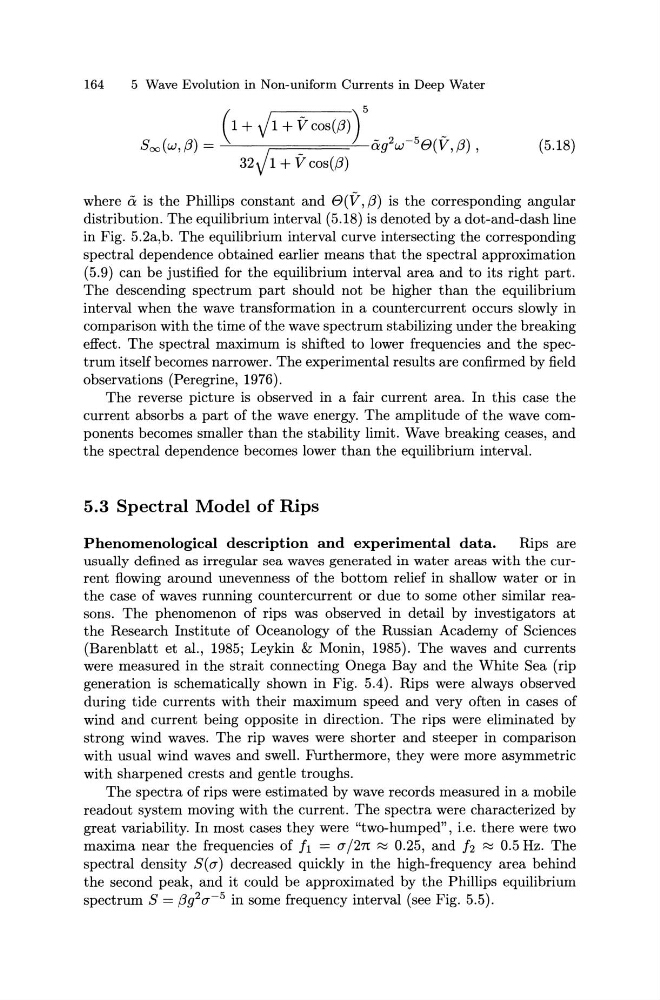
(5.18)
where a is the Phillips constant and 8("V, ,B) is the corresponding angular
distribution. The equilibrium interval (5.18) is denoted by a dot-and-dash line
in Fig. 5.2a,b. The equilibrium interval curve intersecting the corresponding
spectral dependence obtained earlier means that the spectral approximation
(5.9) can be justified for the equilibrium interval area and to its right part.
The descending spectrum part should not be higher than the equilibrium
interval when the wave transformation in a countercurrent occurs slowly in
comparison with the time of the wave spectrum stabilizing under the breaking
effect. The spectral maximum is shifted to lower frequencies and the spectrum itself becomes narrower. The experimental results are confirmed by field
observations (Peregrine, 1976).
The reverse picture is observed in a fair current area. In this case the
current absorbs a part of the wave energy. The amplitude of the wave components becomes smaller than the stability limit. Wave breaking ceases, and
the spectral dependence becomes lower than the equilibrium interval.
5.3 Spectral Model of Rips
Phenomenological description and experimental data.
Rips are
usually defined as irregular sea waves generated in water areas with the current flowing around unevenness of the bottom relief in shallow water or in
the case of waves running countercurrent or due to some other similar reasons. The phenomenon of rips was observed in detail by investigators at
the Research Institute of Oceanology of the Russian Academy of Sciences
(Barenblatt et al., 1985; Leykin & Monin, 1985). The waves and currents
were measured in the strait connecting Onega Bay and the White Sea (rip
generation is schematically shown in Fig. 5.4). Rips were always observed
during tide currents with their maximum speed and very often in cases of
wind and current being opposite in direction. The rips were eliminated by
strong wind waves. The rip waves were shorter and steeper in comparison
with usual wind waves and swell. Furthermore, they were more asymmetric
with sharpened crests and gentle troughs.
The spectra of rips were estimated by wave records measured in a mobile
readout system moving with the current. The spectra were characterized by
great variability. In most cases they were "two-humped", i.e. there were two
maxima near the frequencies of !1 = a j2n ~ 0.25, and h ~ 0.5 Hz. The
spectral density S(a) decreased quickly in the high-frequency area behind
the second peak, and it could be approximated by the Phillips equilibrium
spectrum S = ,Bg 2 a- 5 in some frequency interval (see Fig. 5.5).
5 Wave Evolution in Non-uniform Currents in Deep Water
(5.18)
where a is the Phillips constant and 8("V, ,B) is the corresponding angular
distribution. The equilibrium interval (5.18) is denoted by a dot-and-dash line
in Fig. 5.2a,b. The equilibrium interval curve intersecting the corresponding
spectral dependence obtained earlier means that the spectral approximation
(5.9) can be justified for the equilibrium interval area and to its right part.
The descending spectrum part should not be higher than the equilibrium
interval when the wave transformation in a countercurrent occurs slowly in
comparison with the time of the wave spectrum stabilizing under the breaking
effect. The spectral maximum is shifted to lower frequencies and the spectrum itself becomes narrower. The experimental results are confirmed by field
observations (Peregrine, 1976).
The reverse picture is observed in a fair current area. In this case the
current absorbs a part of the wave energy. The amplitude of the wave components becomes smaller than the stability limit. Wave breaking ceases, and
the spectral dependence becomes lower than the equilibrium interval.
5.3 Spectral Model of Rips
Phenomenological description and experimental data.
Rips are
usually defined as irregular sea waves generated in water areas with the current flowing around unevenness of the bottom relief in shallow water or in
the case of waves running countercurrent or due to some other similar reasons. The phenomenon of rips was observed in detail by investigators at
the Research Institute of Oceanology of the Russian Academy of Sciences
(Barenblatt et al., 1985; Leykin & Monin, 1985). The waves and currents
were measured in the strait connecting Onega Bay and the White Sea (rip
generation is schematically shown in Fig. 5.4). Rips were always observed
during tide currents with their maximum speed and very often in cases of
wind and current being opposite in direction. The rips were eliminated by
strong wind waves. The rip waves were shorter and steeper in comparison
with usual wind waves and swell. Furthermore, they were more asymmetric
with sharpened crests and gentle troughs.
The spectra of rips were estimated by wave records measured in a mobile
readout system moving with the current. The spectra were characterized by
great variability. In most cases they were "two-humped", i.e. there were two
maxima near the frequencies of !1 = a j2n ~ 0.25, and h ~ 0.5 Hz. The
spectral density S(a) decreased quickly in the high-frequency area behind
the second peak, and it could be approximated by the Phillips equilibrium
spectrum S = ,Bg 2 a- 5 in some frequency interval (see Fig. 5.5).