

162
5 Wave Evolution in Non-uniform Currents in Deep Water
where 8(/3, V) is the Heaviside function taking into account the absence of
the wave component in the corresponding plane areas {!3, V }· The spectral
values transformed in the current calculated by (5.9), (5.16) respectively for
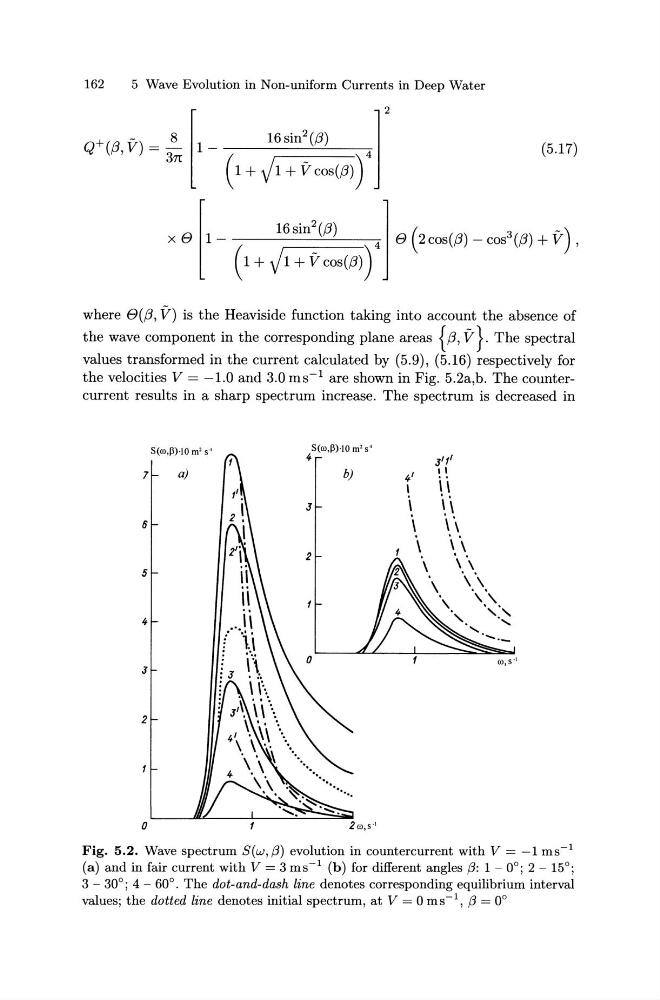
the velocities V = -1.0 and 3.0 ms- 1 are shown in Fig. 5.2a,b. The countercurrent results in a sharp spectrum increase. The spectrum is decreased in
S(ro,Jl)·lO m' s·'
a)
J
0
S(ro,~)·lO m' s'
4
b)
J
2
4'
I
\
\
\
Jlf'
I I
i \
\\
\\
\\
\\
\\
\\,
·,...:~
ro,s-1
Fig. 5.2. Wave spectrum S(w,/3) evolution in countercurrent with V = -1 ms- 1
(a) and in fair current with V = 3 ms- 1 (b) for different angles (3: 1- 0°; 2- 15°;
3 - 30°; 4 - 60°. The dot-and-dash line denotes corresponding equilibrium interval
values; the dotted line denotes initial spectrum, at V = 0 ms- 1 , f3 = 0°
5 Wave Evolution in Non-uniform Currents in Deep Water
where 8(/3, V) is the Heaviside function taking into account the absence of
the wave component in the corresponding plane areas {!3, V }· The spectral
values transformed in the current calculated by (5.9), (5.16) respectively for
the velocities V = -1.0 and 3.0 ms- 1 are shown in Fig. 5.2a,b. The countercurrent results in a sharp spectrum increase. The spectrum is decreased in
S(ro,Jl)·lO m' s·'
a)
J
0
S(ro,~)·lO m' s'
4
b)
J
2
4'
I
\
\
\
Jlf'
I I
i \
\\
\\
\\
\\
\\
\\,
·,...:~
ro,s-1
Fig. 5.2. Wave spectrum S(w,/3) evolution in countercurrent with V = -1 ms- 1
(a) and in fair current with V = 3 ms- 1 (b) for different angles (3: 1- 0°; 2- 15°;
3 - 30°; 4 - 60°. The dot-and-dash line denotes corresponding equilibrium interval
values; the dotted line denotes initial spectrum, at V = 0 ms- 1 , f3 = 0°