

134
4 Physical Mechanisms Forming the Wave Spectrum in Deep Water
Chalikov. It proves expedient to use different approaches for the description
of the physical mechanism in different wind wave frequency bands.
In the dissipation mechanisms, offered by Tolman and Chalikov, the lowfrequency dissipation connected with turbulence in the near-surface oceanic
layer is described by the first function G~~) (a, [3). On the basis of the NavierStockes equations and separation of movements into waves and turbulence
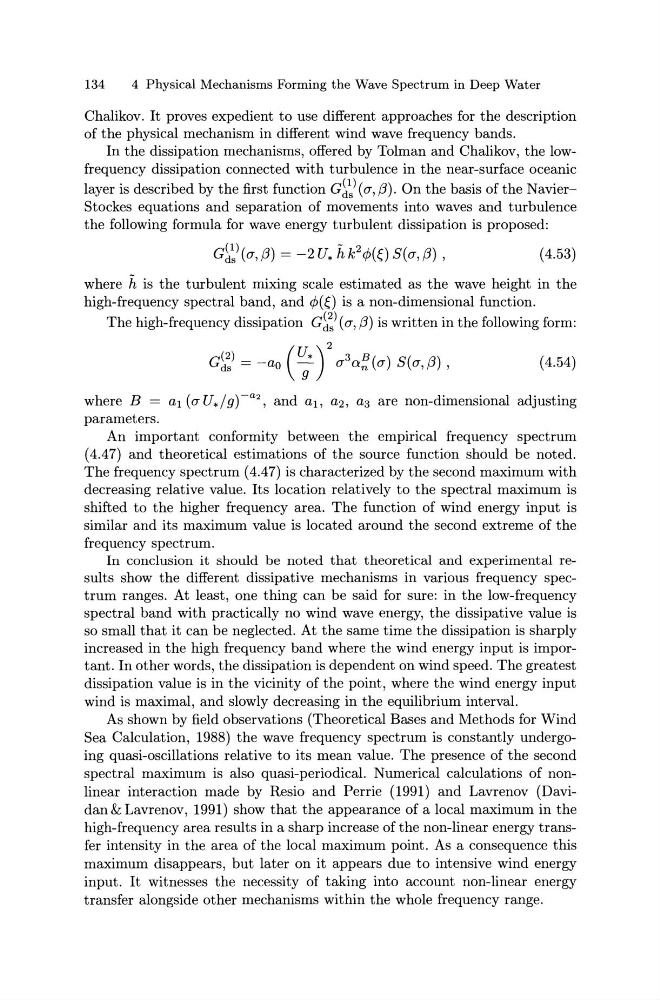
the following formula for wave energy turbulent dissipation is proposed:
(4.53)
where h is the turbulent mixing scale estimated as the wave height in the
high-frequency spectral band, and ¢(') is a non-dimensional function.
The high-frequency dissipation G~~) (a, [3) is written in the following form:
G~~) = -a0 (~*)
2
a 3 a~(a) S(a,/3),
(4.54)
where B = a1 (aU*/ g) -a 2 , and a1 , a2 , a3 are non-dimensional adjusting
parameters.
An important conformity between the empirical frequency spectrum
( 4.4 7) and theoretical estimations of the source function should be noted.
The frequency spectrum (4.47) is characterized by the second maximum with
decreasing relative value. Its location relatively to the spectral maximum is
shifted to the higher frequency area. The function of wind energy input is
similar and its maximum value is located around the second extreme of the
frequency spectrum.
In conclusion it should be noted that theoretical and experimental results show the different dissipative mechanisms in various frequency spectrum ranges. At least, one thing can be said for sure: in the low-frequency
spectral band with practically no wind wave energy, the dissipative value is
so small that it can be neglected. At the same time the dissipation is sharply
increased in the high frequency band where the wind energy input is important. In other words, the dissipation is dependent on wind speed. The greatest
dissipation value is in the vicinity of the point, where the wind energy input
wind is maximal, and slowly decreasing in the equilibrium interval.
As shown by field observations (Theoretical Bases and Methods for Wind
Sea Calculation, 1988) the wave frequency spectrum is constantly undergoing quasi-oscillations relative to its mean value. The presence of the second
spectral maximum is also quasi-periodical. Numerical calculations of nonlinear interaction made by Resio and Perrie (1991) and Lavrenov (Davidan & Lavrenov, 1991) show that the appearance of a local maximum in the
high-frequency area results in a sharp increase of the non-linear energy transfer intensity in the area of the local maximum point. As a consequence this
maximum disappears, but later on it appears due to intensive wind energy
input. It witnesses the necessity of taking into account non-linear energy
transfer alongside other mechanisms within the whole frequency range.
4 Physical Mechanisms Forming the Wave Spectrum in Deep Water
Chalikov. It proves expedient to use different approaches for the description
of the physical mechanism in different wind wave frequency bands.
In the dissipation mechanisms, offered by Tolman and Chalikov, the lowfrequency dissipation connected with turbulence in the near-surface oceanic
layer is described by the first function G~~) (a, [3). On the basis of the NavierStockes equations and separation of movements into waves and turbulence
the following formula for wave energy turbulent dissipation is proposed:
(4.53)
where h is the turbulent mixing scale estimated as the wave height in the
high-frequency spectral band, and ¢(') is a non-dimensional function.
The high-frequency dissipation G~~) (a, [3) is written in the following form:
G~~) = -a0 (~*)
2
a 3 a~(a) S(a,/3),
(4.54)
where B = a1 (aU*/ g) -a 2 , and a1 , a2 , a3 are non-dimensional adjusting
parameters.
An important conformity between the empirical frequency spectrum
( 4.4 7) and theoretical estimations of the source function should be noted.
The frequency spectrum (4.47) is characterized by the second maximum with
decreasing relative value. Its location relatively to the spectral maximum is
shifted to the higher frequency area. The function of wind energy input is
similar and its maximum value is located around the second extreme of the
frequency spectrum.
In conclusion it should be noted that theoretical and experimental results show the different dissipative mechanisms in various frequency spectrum ranges. At least, one thing can be said for sure: in the low-frequency
spectral band with practically no wind wave energy, the dissipative value is
so small that it can be neglected. At the same time the dissipation is sharply
increased in the high frequency band where the wind energy input is important. In other words, the dissipation is dependent on wind speed. The greatest
dissipation value is in the vicinity of the point, where the wind energy input
wind is maximal, and slowly decreasing in the equilibrium interval.
As shown by field observations (Theoretical Bases and Methods for Wind
Sea Calculation, 1988) the wave frequency spectrum is constantly undergoing quasi-oscillations relative to its mean value. The presence of the second
spectral maximum is also quasi-periodical. Numerical calculations of nonlinear interaction made by Resio and Perrie (1991) and Lavrenov (Davidan & Lavrenov, 1991) show that the appearance of a local maximum in the
high-frequency area results in a sharp increase of the non-linear energy transfer intensity in the area of the local maximum point. As a consequence this
maximum disappears, but later on it appears due to intensive wind energy
input. It witnesses the necessity of taking into account non-linear energy
transfer alongside other mechanisms within the whole frequency range.