

4.0()a)
-4.0ob)
-6.00
4.1 Non-Linear Energy Transfer in Wind Wave Spectrum
95
-4.00
-2.00
0.00
2.00
4.00
6.00
1.00000
0.90000
0.80000
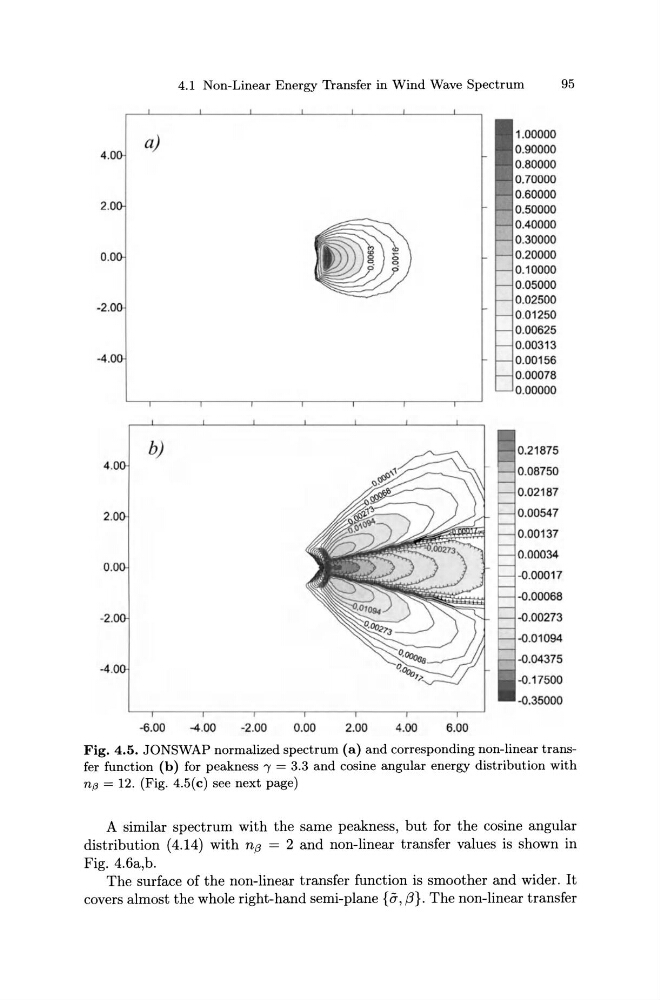
Fig. 4.5. JONSWAP normalized spectrum (a) and corresponding non-linear transfer function (b) for peakness 1 = 3.3 and cosine angular energy distribution with
n13 = 12. (Fig. 4.5(c) see next page)
A similar spectrum with the same peakness, but for the cosine angular
distribution (4.14) with nf3 = 2 and non-linear transfer values is shown in
Fig. 4.6a,b.
The surface of the non-linear transfer function is smoother and wider. It
covers almost the whole right-hand semi-plane {a, ,B}. The non-linear transfer
-4.0ob)
-6.00
4.1 Non-Linear Energy Transfer in Wind Wave Spectrum
95
-4.00
-2.00
0.00
2.00
4.00
6.00
1.00000
0.90000
0.80000
Fig. 4.5. JONSWAP normalized spectrum (a) and corresponding non-linear transfer function (b) for peakness 1 = 3.3 and cosine angular energy distribution with
n13 = 12. (Fig. 4.5(c) see next page)
A similar spectrum with the same peakness, but for the cosine angular
distribution (4.14) with nf3 = 2 and non-linear transfer values is shown in
Fig. 4.6a,b.
The surface of the non-linear transfer function is smoother and wider. It
covers almost the whole right-hand semi-plane {a, ,B}. The non-linear transfer