

563
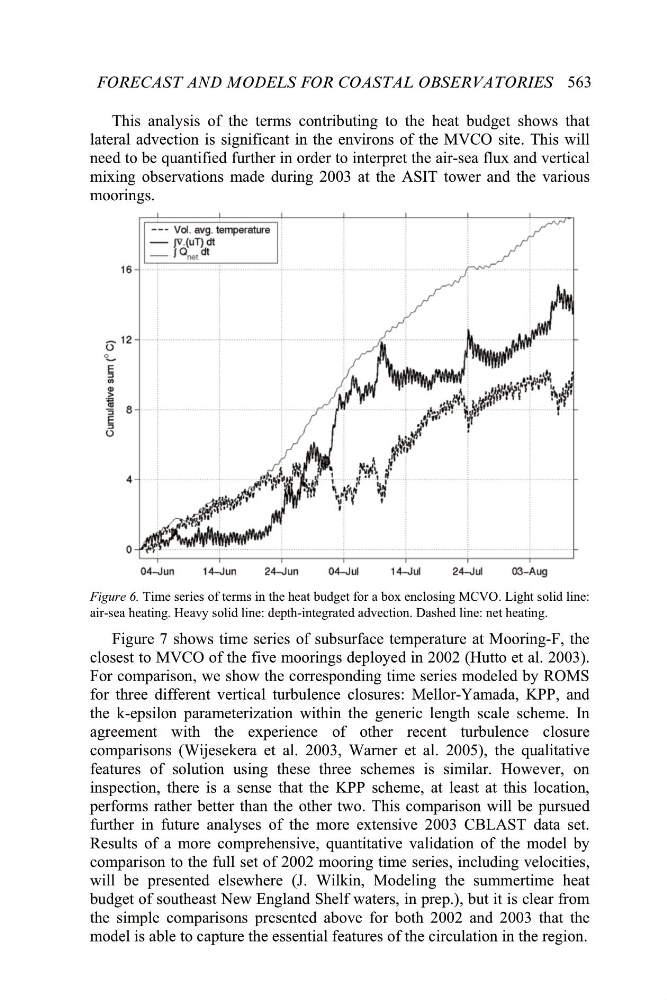
This analysis of the terms contributing to the heat budget shows that
lateral advection is significant in the environs of the MVCO site. This will
need to be quantified further in order to interpret the air-sea flux and vertical
mixing observations made during 2003 at the ASIT tower and the various
moorings.
Figure 6. Time series of terms in the heat budget for a box enclosing MCVO. Light solid line:
air-sea heating. Heavy solid line: depth-integrated advection. Dashed line: net heating.
Figure 7 shows time series of subsurface temperature at Mooring-F, the
closest to MVCO of the five moorings deployed in 2002 (Hutto et al. 2003).
For comparison, we show the corresponding time series modeled by ROMS
for three different vertical turbulence closures: Mellor-Yamada, KPP, and
the k-epsilon parameterization within the generic length scale scheme. In
agreement with the experience of other recent turbulence closure
comparisons (Wijesekera et al. 2003, Warner et al. 2005), the qualitative
features of solution using these three schemes is similar. However, on
inspection, there is a sense that the KPP scheme, at least at this location,
performs rather better than the other two. This comparison will be pursued
further in future analyses of the more extensive 2003 CBLAST data set.
Results of a more comprehensive, quantitative validation of the model by
comparison to the full set of 2002 mooring time series, including velocities,
will be presented elsewhere (J. Wilkin, Modeling the summertime heat
budget of southeast New England Shelf waters, in prep.), but it is clear from
the simple comparisons presented above for both 2002 and 2003 that the
model is able to capture the essential features of the circulation in the region.
FORECAST AND MODELS FOR COASTAL OBSERVATORIES