

498
MARY ALTALO
- $30-60 million for electric distribution companies in the Northeast.
Scaled up to a National basis, the estimates would be in the 100’s of
millions.
Furthermore, capturing the “events” such as seabreeze, fronts, “pop-up”
afternoon thunderstorms etc., on top of this will yield significantly higher
savings (10’s millions/day regionally).
Urban Utility Case Study
Urban Utility Case Study
Findings 1: Significant load
Findings 1: Significant load
error due to weather
error due to weather
Weather Variance (%) Summer 2002 over Service Territory
-6.0%
-4.0%
-2.0%
0.0%
2.0%
4.0%
6.0%
8.0%
10.0%
1 - J u l
8 - J u l
1 5 -J
u l
2 2 -J
u l
2 9 -J
u l
5 - A u g
1 2 -A
u g
1 9 -A
u g
2 6 -A
u g
Date
Variance
Weather Variance (%)*
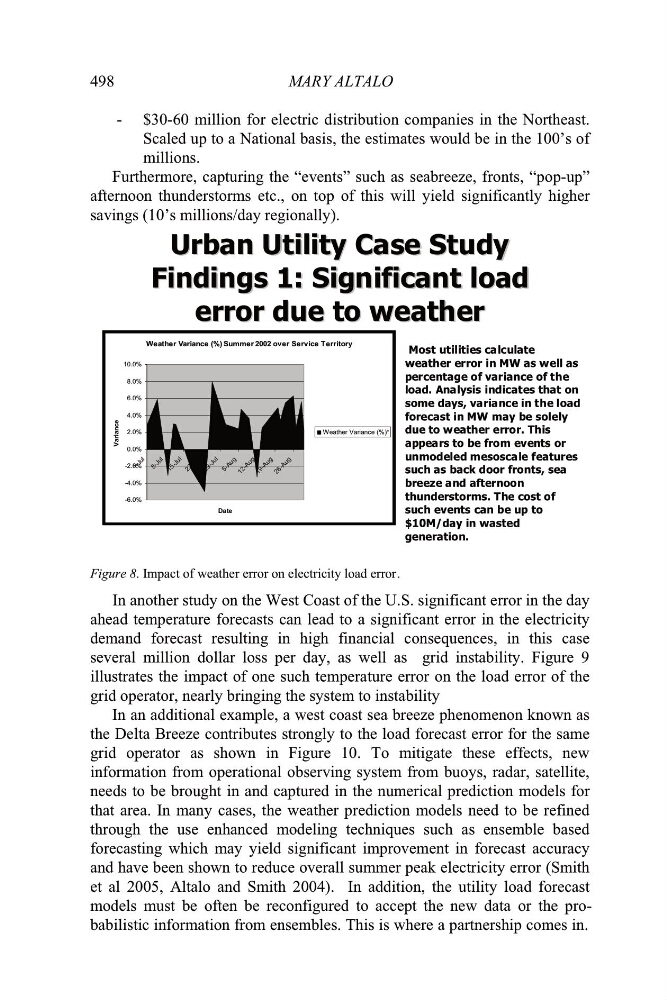
Most utilities calculate
weather error in MW as well as
percentage of variance of the
load. Analysis indicates that on
some days, variance in the load
forecast in MW may be solely
due to weather error. This
appears to be from events or
unmodeled mesoscale features
such as back door fronts, sea
breeze and afternoon
thunderstorms. The cost of
such events can be up to
$10M/day in wasted
generation.
Figure 8. Impact of weather error on electricity load error
In another study on the West Coast of the U.S. significant error in the day
ahead temperature forecasts can lead to a significant error in the electricity
demand forecast resulting in high financial consequences, in this case
several million dollar loss per day, as well as grid instability. Figure 9
illustrates the impact of one such temperature error on the load error of the
grid operator, nearly bringing the system to instability
In an additional example, a west coast sea breeze phenomenon known as
the Delta Breeze contributes strongly to the load forecast error for the same
grid operator as shown in Figure 10. To mitigate these effects, new
information from operational observing system from buoys, radar, satellite,
needs to be brought in and captured in the numerical prediction models for
that area. In many cases, the weather prediction models need to be refined
through the use enhanced modeling techniques such as ensemble based
forecasting which may yield significant improvement in forecast accuracy
and have been shown to reduce overall summer peak electricity error (Smith
et al 2005, Altalo and Smith 2004). In addition, the utility load forecast
.
models must be often be reconfigured to accept the new data or the probabilistic information from ensembles. This is where a partnership comes in.
MARY ALTALO
- $30-60 million for electric distribution companies in the Northeast.
Scaled up to a National basis, the estimates would be in the 100’s of
millions.
Furthermore, capturing the “events” such as seabreeze, fronts, “pop-up”
afternoon thunderstorms etc., on top of this will yield significantly higher
savings (10’s millions/day regionally).
Urban Utility Case Study
Urban Utility Case Study
Findings 1: Significant load
Findings 1: Significant load
error due to weather
error due to weather
Weather Variance (%) Summer 2002 over Service Territory
-6.0%
-4.0%
-2.0%
0.0%
2.0%
4.0%
6.0%
8.0%
10.0%
1 - J u l
8 - J u l
1 5 -J
u l
2 2 -J
u l
2 9 -J
u l
5 - A u g
1 2 -A
u g
1 9 -A
u g
2 6 -A
u g
Date
Variance
Weather Variance (%)*
Most utilities calculate
weather error in MW as well as
percentage of variance of the
load. Analysis indicates that on
some days, variance in the load
forecast in MW may be solely
due to weather error. This
appears to be from events or
unmodeled mesoscale features
such as back door fronts, sea
breeze and afternoon
thunderstorms. The cost of
such events can be up to
$10M/day in wasted
generation.
Figure 8. Impact of weather error on electricity load error
In another study on the West Coast of the U.S. significant error in the day
ahead temperature forecasts can lead to a significant error in the electricity
demand forecast resulting in high financial consequences, in this case
several million dollar loss per day, as well as grid instability. Figure 9
illustrates the impact of one such temperature error on the load error of the
grid operator, nearly bringing the system to instability
In an additional example, a west coast sea breeze phenomenon known as
the Delta Breeze contributes strongly to the load forecast error for the same
grid operator as shown in Figure 10. To mitigate these effects, new
information from operational observing system from buoys, radar, satellite,
needs to be brought in and captured in the numerical prediction models for
that area. In many cases, the weather prediction models need to be refined
through the use enhanced modeling techniques such as ensemble based
forecasting which may yield significant improvement in forecast accuracy
and have been shown to reduce overall summer peak electricity error (Smith
et al 2005, Altalo and Smith 2004). In addition, the utility load forecast
.
models must be often be reconfigured to accept the new data or the probabilistic information from ensembles. This is where a partnership comes in.