

78
3 Basics of Nonhydrostatic Modelling
ratio is again R ρ = 1, but the initial Turner angle is T u = −90
◦ (see Fig. 3.41). The
total simulation time is 1 hr with data outputs at 1-min intervals.
3.20.3 Results
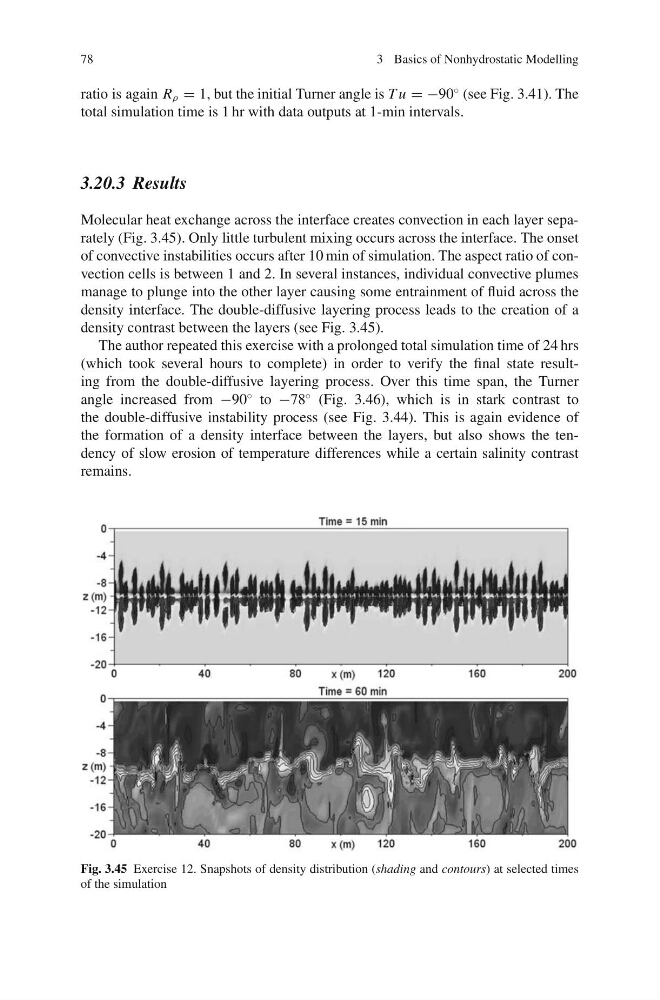
Molecular heat exchange across the interface creates convection in each layer separately (Fig. 3.45). Only little turbulent mixing occurs across the interface. The onset
of convective instabilities occurs after 10 min of simulation. The aspect ratio of convection cells is between 1 and 2. In several instances, individual convective plumes
manage to plunge into the other layer causing some entrainment of fluid across the
density interface. The double-diffusive layering process leads to the creation of a
density contrast between the layers (see Fig. 3.45).
The author repeated this exercise with a prolonged total simulation time of 24 hrs
(which took several hours to complete) in order to verify the final state resulting from the double-diffusive layering process. Over this time span, the Turner
angle increased from −90
◦ to −78
◦ (Fig. 3.46), which is in stark contrast to
the double-diffusive instability process (see Fig. 3.44). This is again evidence of
the formation of a density interface between the layers, but also shows the tendency of slow erosion of temperature differences while a certain salinity contrast
remains.
Fig. 3.45 Exercise 12. Snapshots of density distribution (shading and contours) at selected times
of the simulation
3 Basics of Nonhydrostatic Modelling
ratio is again R ρ = 1, but the initial Turner angle is T u = −90
◦ (see Fig. 3.41). The
total simulation time is 1 hr with data outputs at 1-min intervals.
3.20.3 Results
Molecular heat exchange across the interface creates convection in each layer separately (Fig. 3.45). Only little turbulent mixing occurs across the interface. The onset
of convective instabilities occurs after 10 min of simulation. The aspect ratio of convection cells is between 1 and 2. In several instances, individual convective plumes
manage to plunge into the other layer causing some entrainment of fluid across the
density interface. The double-diffusive layering process leads to the creation of a
density contrast between the layers (see Fig. 3.45).
The author repeated this exercise with a prolonged total simulation time of 24 hrs
(which took several hours to complete) in order to verify the final state resulting from the double-diffusive layering process. Over this time span, the Turner
angle increased from −90
◦ to −78
◦ (Fig. 3.46), which is in stark contrast to
the double-diffusive instability process (see Fig. 3.44). This is again evidence of
the formation of a density interface between the layers, but also shows the tendency of slow erosion of temperature differences while a certain salinity contrast
remains.
Fig. 3.45 Exercise 12. Snapshots of density distribution (shading and contours) at selected times
of the simulation