

5.9 The Equatorial Barrier
157
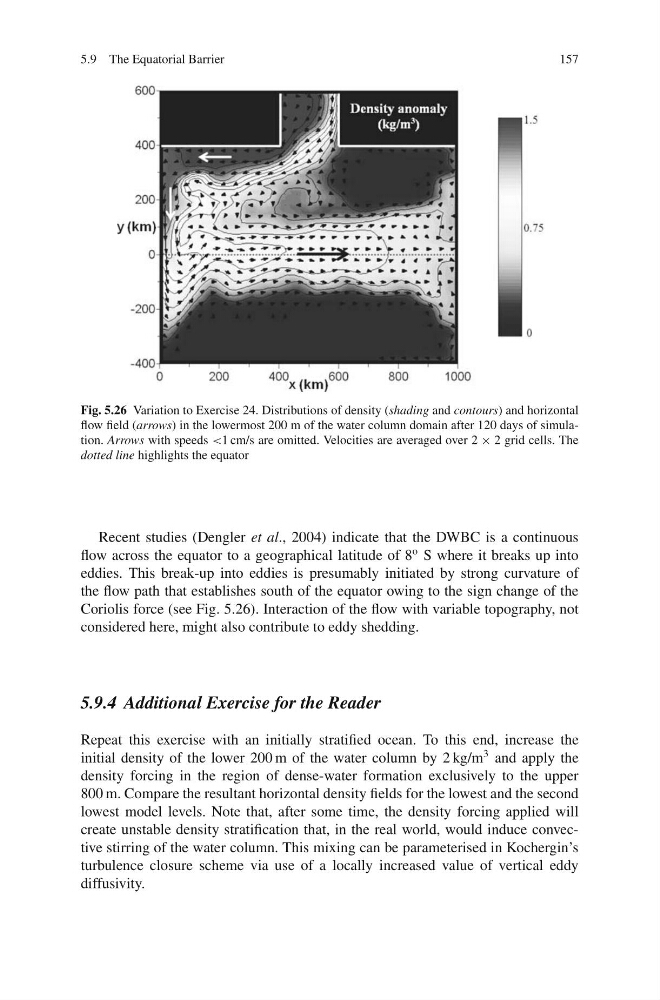
Fig. 5.26 Variation to Exercise 24. Distributions of density (shading and contours) and horizontal
flow field (arrows) in the lowermost 200 m of the water column domain after 120 days of simulation. Arrows with speeds <1 cm/s are omitted. Velocities are averaged over 2 × 2 grid cells. The
dotted line highlights the equator
Recent studies (Dengler et al., 2004) indicate that the DWBC is a continuous
flow across the equator to a geographical latitude of 8
o S where it breaks up into
eddies. This break-up into eddies is presumably initiated by strong curvature of
the flow path that establishes south of the equator owing to the sign change of the
Coriolis force (see Fig. 5.26). Interaction of the flow with variable topography, not
considered here, might also contribute to eddy shedding.
5.9.4 Additional Exercise for the Reader
Repeat this exercise with an initially stratified ocean. To this end, increase the
initial density of the lower 200 m of the water column by 2 kg/m
3 and apply the
density forcing in the region of dense-water formation exclusively to the upper
800 m. Compare the resultant horizontal density fields for the lowest and the second
lowest model levels. Note that, after some time, the density forcing applied will
create unstable density stratification that, in the real world, would induce convective stirring of the water column. This mixing can be parameterised in Kochergin’s
turbulence closure scheme via use of a locally increased value of vertical eddy
diffusivity.
157
Fig. 5.26 Variation to Exercise 24. Distributions of density (shading and contours) and horizontal
flow field (arrows) in the lowermost 200 m of the water column domain after 120 days of simulation. Arrows with speeds <1 cm/s are omitted. Velocities are averaged over 2 × 2 grid cells. The
dotted line highlights the equator
Recent studies (Dengler et al., 2004) indicate that the DWBC is a continuous
flow across the equator to a geographical latitude of 8
o S where it breaks up into
eddies. This break-up into eddies is presumably initiated by strong curvature of
the flow path that establishes south of the equator owing to the sign change of the
Coriolis force (see Fig. 5.26). Interaction of the flow with variable topography, not
considered here, might also contribute to eddy shedding.
5.9.4 Additional Exercise for the Reader
Repeat this exercise with an initially stratified ocean. To this end, increase the
initial density of the lower 200 m of the water column by 2 kg/m
3 and apply the
density forcing in the region of dense-water formation exclusively to the upper
800 m. Compare the resultant horizontal density fields for the lowest and the second
lowest model levels. Note that, after some time, the density forcing applied will
create unstable density stratification that, in the real world, would induce convective stirring of the water column. This mixing can be parameterised in Kochergin’s
turbulence closure scheme via use of a locally increased value of vertical eddy
diffusivity.