

144
5 3D Level Modelling
geostrophic flow follows bathymetry contours and circulates smoothly around the
bay. Onshore flow in the bottom Ekman layer results in coastal upwelling in which
deeper water reaches the sea surface after about 5 days of simulation.
The surface flow attains speeds of up to 80 cm/s along the upwelling front that
gradually moves away from the southern coastline of the headland. Owing to this
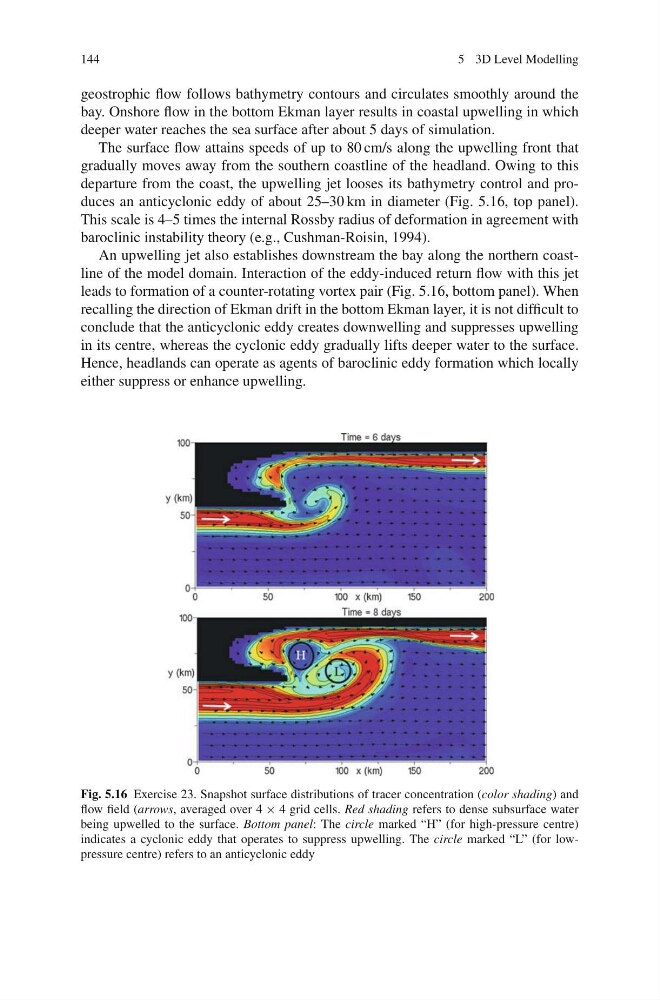
departure from the coast, the upwelling jet looses its bathymetry control and produces an anticyclonic eddy of about 25–30 km in diameter (Fig. 5.16, top panel).
This scale is 4–5 times the internal Rossby radius of deformation in agreement with
baroclinic instability theory (e.g., Cushman-Roisin, 1994).
An upwelling jet also establishes downstream the bay along the northern coastline of the model domain. Interaction of the eddy-induced return flow with this jet
leads to formation of a counter-rotating vortex pair (Fig. 5.16, bottom panel). When
recalling the direction of Ekman drift in the bottom Ekman layer, it is not difficult to
conclude that the anticyclonic eddy creates downwelling and suppresses upwelling
in its centre, whereas the cyclonic eddy gradually lifts deeper water to the surface.
Hence, headlands can operate as agents of baroclinic eddy formation which locally
either suppress or enhance upwelling.
Fig. 5.16 Exercise 23. Snapshot surface distributions of tracer concentration (color shading) and
flow field (arrows, averaged over 4 × 4 grid cells. Red shading refers to dense subsurface water
being upwelled to the surface. Bottom panel: The circle marked “H” (for high-pressure centre)
indicates a cyclonic eddy that operates to suppress upwelling. The circle marked “L” (for lowpressure centre) refers to an anticyclonic eddy
5 3D Level Modelling
geostrophic flow follows bathymetry contours and circulates smoothly around the
bay. Onshore flow in the bottom Ekman layer results in coastal upwelling in which
deeper water reaches the sea surface after about 5 days of simulation.
The surface flow attains speeds of up to 80 cm/s along the upwelling front that
gradually moves away from the southern coastline of the headland. Owing to this
departure from the coast, the upwelling jet looses its bathymetry control and produces an anticyclonic eddy of about 25–30 km in diameter (Fig. 5.16, top panel).
This scale is 4–5 times the internal Rossby radius of deformation in agreement with
baroclinic instability theory (e.g., Cushman-Roisin, 1994).
An upwelling jet also establishes downstream the bay along the northern coastline of the model domain. Interaction of the eddy-induced return flow with this jet
leads to formation of a counter-rotating vortex pair (Fig. 5.16, bottom panel). When
recalling the direction of Ekman drift in the bottom Ekman layer, it is not difficult to
conclude that the anticyclonic eddy creates downwelling and suppresses upwelling
in its centre, whereas the cyclonic eddy gradually lifts deeper water to the surface.
Hence, headlands can operate as agents of baroclinic eddy formation which locally
either suppress or enhance upwelling.
Fig. 5.16 Exercise 23. Snapshot surface distributions of tracer concentration (color shading) and
flow field (arrows, averaged over 4 × 4 grid cells. Red shading refers to dense subsurface water
being upwelled to the surface. Bottom panel: The circle marked “H” (for high-pressure centre)
indicates a cyclonic eddy that operates to suppress upwelling. The circle marked “L” (for lowpressure centre) refers to an anticyclonic eddy