

90
3 Basics of Nonhydrostatic Modelling
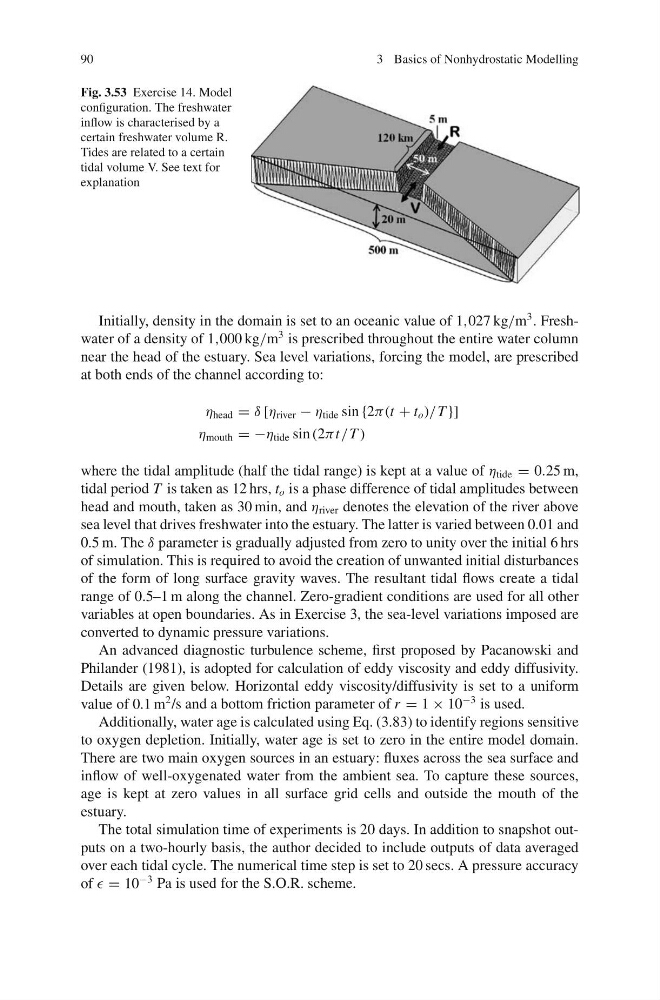
Fig. 3.53 Exercise 14. Model
configuration. The freshwater
inflow is characterised by a
certain freshwater volume R.
Tides are related to a certain
tidal volume V. See text for
explanation
Initially, density in the domain is set to an oceanic value of 1,027 kg/m
3 . Freshwater of a density of 1,000 kg/m
3 is prescribed throughout the entire water column
near the head of the estuary. Sea level variations, forcing the model, are prescribed
at both ends of the channel according to:
η head = δ [η river − η tide sin {2π (t + t o )/T }]
η mouth = −η tide sin (2π t/T )
where the tidal amplitude (half the tidal range) is kept at a value of η tide = 0.25 m,
tidal period T is taken as 12 hrs, t o is a phase difference of tidal amplitudes between
head and mouth, taken as 30 min, and η river denotes the elevation of the river above
sea level that drives freshwater into the estuary. The latter is varied between 0.01 and
0.5 m. The δ parameter is gradually adjusted from zero to unity over the initial 6 hrs
of simulation. This is required to avoid the creation of unwanted initial disturbances
of the form of long surface gravity waves. The resultant tidal flows create a tidal
range of 0.5–1 m along the channel. Zero-gradient conditions are used for all other
variables at open boundaries. As in Exercise 3, the sea-level variations imposed are
converted to dynamic pressure variations.
An advanced diagnostic turbulence scheme, first proposed by Pacanowski and
Philander (1981), is adopted for calculation of eddy viscosity and eddy diffusivity.
Details are given below. Horizontal eddy viscosity/diffusivity is set to a uniform
value of 0.1 m
2 /s and a bottom friction parameter of r = 1 × 10
−3 is used.
Additionally, water age is calculated using Eq. (3.83) to identify regions sensitive
to oxygen depletion. Initially, water age is set to zero in the entire model domain.
There are two main oxygen sources in an estuary: fluxes across the sea surface and
inflow of well-oxygenated water from the ambient sea. To capture these sources,
age is kept at zero values in all surface grid cells and outside the mouth of the
estuary.
The total simulation time of experiments is 20 days. In addition to snapshot outputs on a two-hourly basis, the author decided to include outputs of data averaged
over each tidal cycle. The numerical time step is set to 20 secs. A pressure accuracy
of = 10
−3 Pa is used for the S.O.R. scheme.
3 Basics of Nonhydrostatic Modelling
Fig. 3.53 Exercise 14. Model
configuration. The freshwater
inflow is characterised by a
certain freshwater volume R.
Tides are related to a certain
tidal volume V. See text for
explanation
Initially, density in the domain is set to an oceanic value of 1,027 kg/m
3 . Freshwater of a density of 1,000 kg/m
3 is prescribed throughout the entire water column
near the head of the estuary. Sea level variations, forcing the model, are prescribed
at both ends of the channel according to:
η head = δ [η river − η tide sin {2π (t + t o )/T }]
η mouth = −η tide sin (2π t/T )
where the tidal amplitude (half the tidal range) is kept at a value of η tide = 0.25 m,
tidal period T is taken as 12 hrs, t o is a phase difference of tidal amplitudes between
head and mouth, taken as 30 min, and η river denotes the elevation of the river above
sea level that drives freshwater into the estuary. The latter is varied between 0.01 and
0.5 m. The δ parameter is gradually adjusted from zero to unity over the initial 6 hrs
of simulation. This is required to avoid the creation of unwanted initial disturbances
of the form of long surface gravity waves. The resultant tidal flows create a tidal
range of 0.5–1 m along the channel. Zero-gradient conditions are used for all other
variables at open boundaries. As in Exercise 3, the sea-level variations imposed are
converted to dynamic pressure variations.
An advanced diagnostic turbulence scheme, first proposed by Pacanowski and
Philander (1981), is adopted for calculation of eddy viscosity and eddy diffusivity.
Details are given below. Horizontal eddy viscosity/diffusivity is set to a uniform
value of 0.1 m
2 /s and a bottom friction parameter of r = 1 × 10
−3 is used.
Additionally, water age is calculated using Eq. (3.83) to identify regions sensitive
to oxygen depletion. Initially, water age is set to zero in the entire model domain.
There are two main oxygen sources in an estuary: fluxes across the sea surface and
inflow of well-oxygenated water from the ambient sea. To capture these sources,
age is kept at zero values in all surface grid cells and outside the mouth of the
estuary.
The total simulation time of experiments is 20 days. In addition to snapshot outputs on a two-hourly basis, the author decided to include outputs of data averaged
over each tidal cycle. The numerical time step is set to 20 secs. A pressure accuracy
of = 10
−3 Pa is used for the S.O.R. scheme.