

298
H.R. Gordon
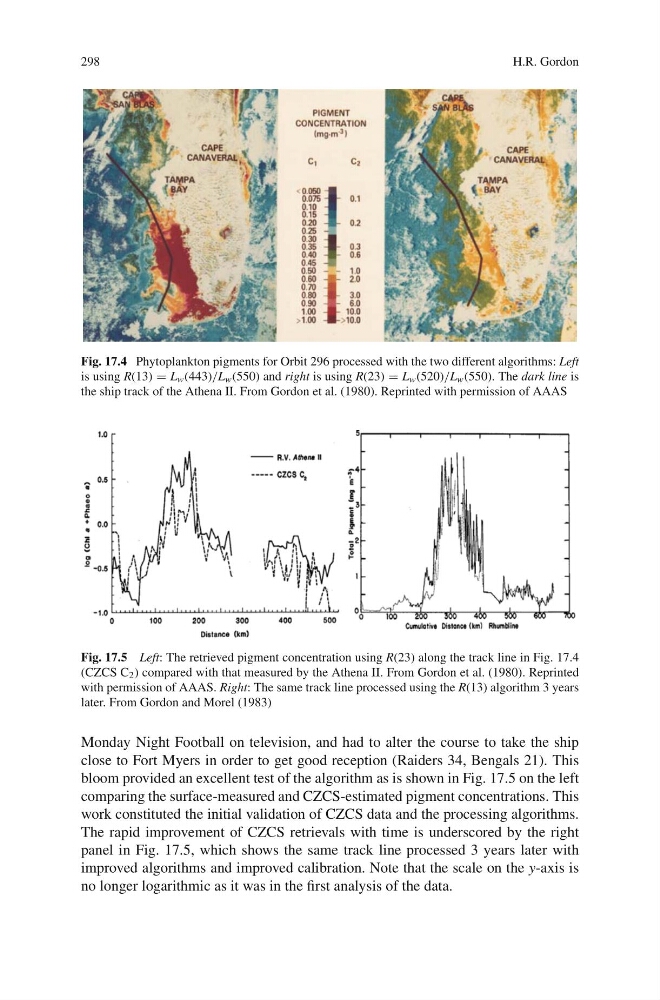
Fig. 17.4 Phytoplankton pigments for Orbit 296 processed with the two different algorithms: Left
is using R(13) = L w (443)/L w (550) and right is using R(23) = L w (520)/L w (550). The dark line is
the ship track of the Athena II. From Gordon et al. (1980). Reprinted with permission of AAAS
Fig. 17.5 Left: The retrieved pigment concentration using R(23) along the track line in Fig. 17.4
(CZCS C 2 ) compared with that measured by the Athena II. From Gordon et al. (1980). Reprinted
with permission of AAAS. Right: The same track line processed using the R(13) algorithm 3 years
later. From Gordon and Morel (1983)
Monday Night Football on television, and had to alter the course to take the ship
close to Fort Myers in order to get good reception (Raiders 34, Bengals 21). This
bloom provided an excellent test of the algorithm as is shown in Fig. 17.5 on the left
comparing the surface-measured and CZCS-estimated pigment concentrations. This
work constituted the initial validation of CZCS data and the processing algorithms.
The rapid improvement of CZCS retrievals with time is underscored by the right
panel in Fig. 17.5, which shows the same track line processed 3 years later with
improved algorithms and improved calibration. Note that the scale on the y-axis is
no longer logarithmic as it was in the first analysis of the data.
H.R. Gordon
Fig. 17.4 Phytoplankton pigments for Orbit 296 processed with the two different algorithms: Left
is using R(13) = L w (443)/L w (550) and right is using R(23) = L w (520)/L w (550). The dark line is
the ship track of the Athena II. From Gordon et al. (1980). Reprinted with permission of AAAS
Fig. 17.5 Left: The retrieved pigment concentration using R(23) along the track line in Fig. 17.4
(CZCS C 2 ) compared with that measured by the Athena II. From Gordon et al. (1980). Reprinted
with permission of AAAS. Right: The same track line processed using the R(13) algorithm 3 years
later. From Gordon and Morel (1983)
Monday Night Football on television, and had to alter the course to take the ship
close to Fort Myers in order to get good reception (Raiders 34, Bengals 21). This
bloom provided an excellent test of the algorithm as is shown in Fig. 17.5 on the left
comparing the surface-measured and CZCS-estimated pigment concentrations. This
work constituted the initial validation of CZCS data and the processing algorithms.
The rapid improvement of CZCS retrievals with time is underscored by the right
panel in Fig. 17.5, which shows the same track line processed 3 years later with
improved algorithms and improved calibration. Note that the scale on the y-axis is
no longer logarithmic as it was in the first analysis of the data.