

17 Some Reflections on Thirty-Five Years of Ocean Color Remote Sensing
297
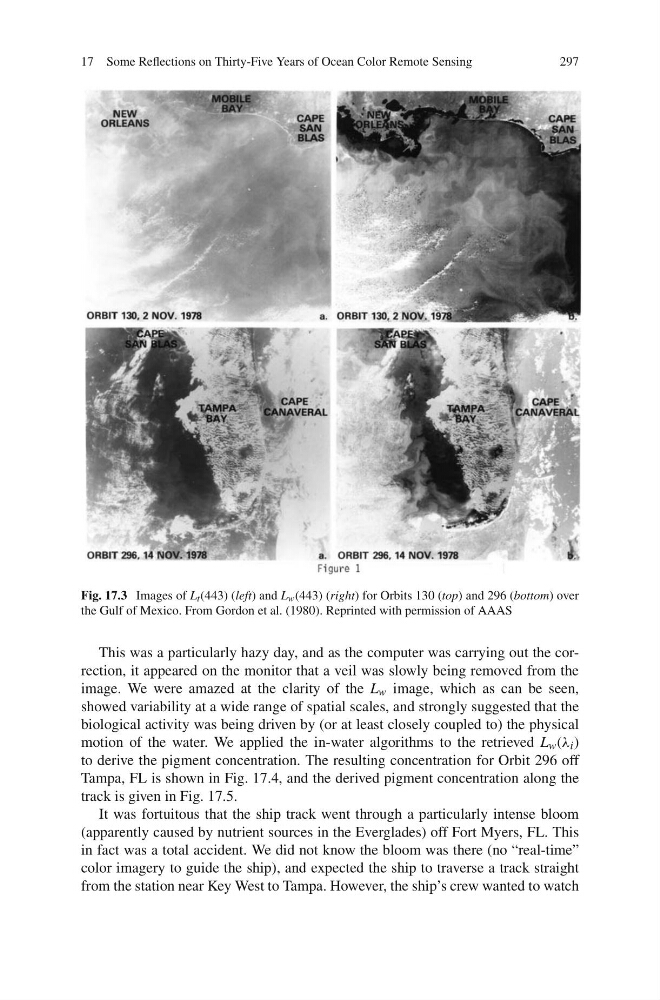
Fig. 17.3 Images of L t (443) (left) and L w (443) (right) for Orbits 130 (top) and 296 (bottom) over
the Gulf of Mexico. From Gordon et al. (1980). Reprinted with permission of AAAS
This was a particularly hazy day, and as the computer was carrying out the correction, it appeared on the monitor that a veil was slowly being removed from the
image. We were amazed at the clarity of the L w image, which as can be seen,
showed variability at a wide range of spatial scales, and strongly suggested that the
biological activity was being driven by (or at least closely coupled to) the physical
motion of the water. We applied the in-water algorithms to the retrieved L w (λ i )
to derive the pigment concentration. The resulting concentration for Orbit 296 off
Tampa, FL is shown in Fig. 17.4, and the derived pigment concentration along the
track is given in Fig. 17.5.
It was fortuitous that the ship track went through a particularly intense bloom
(apparently caused by nutrient sources in the Everglades) off Fort Myers, FL. This
in fact was a total accident. We did not know the bloom was there (no “real-time”
color imagery to guide the ship), and expected the ship to traverse a track straight
from the station near Key West to Tampa. However, the ship’s crew wanted to watch
297
Fig. 17.3 Images of L t (443) (left) and L w (443) (right) for Orbits 130 (top) and 296 (bottom) over
the Gulf of Mexico. From Gordon et al. (1980). Reprinted with permission of AAAS
This was a particularly hazy day, and as the computer was carrying out the correction, it appeared on the monitor that a veil was slowly being removed from the
image. We were amazed at the clarity of the L w image, which as can be seen,
showed variability at a wide range of spatial scales, and strongly suggested that the
biological activity was being driven by (or at least closely coupled to) the physical
motion of the water. We applied the in-water algorithms to the retrieved L w (λ i )
to derive the pigment concentration. The resulting concentration for Orbit 296 off
Tampa, FL is shown in Fig. 17.4, and the derived pigment concentration along the
track is given in Fig. 17.5.
It was fortuitous that the ship track went through a particularly intense bloom
(apparently caused by nutrient sources in the Everglades) off Fort Myers, FL. This
in fact was a total accident. We did not know the bloom was there (no “real-time”
color imagery to guide the ship), and expected the ship to traverse a track straight
from the station near Key West to Tampa. However, the ship’s crew wanted to watch