

168
M.-H. Rio
Fig. 10.2 Mean dynamic topography computed at 300 km resolution through the direct
method using the CLS01 MSS and (a) GRIM5S1 (b) CHAMP3S (c) GGM02S (d) EIGENGRGS.RL02.MEAN-FIELD
entirely cancelled out in 2009 at scales greater than 300 km with the use of more
than 4 years of GRACE data.
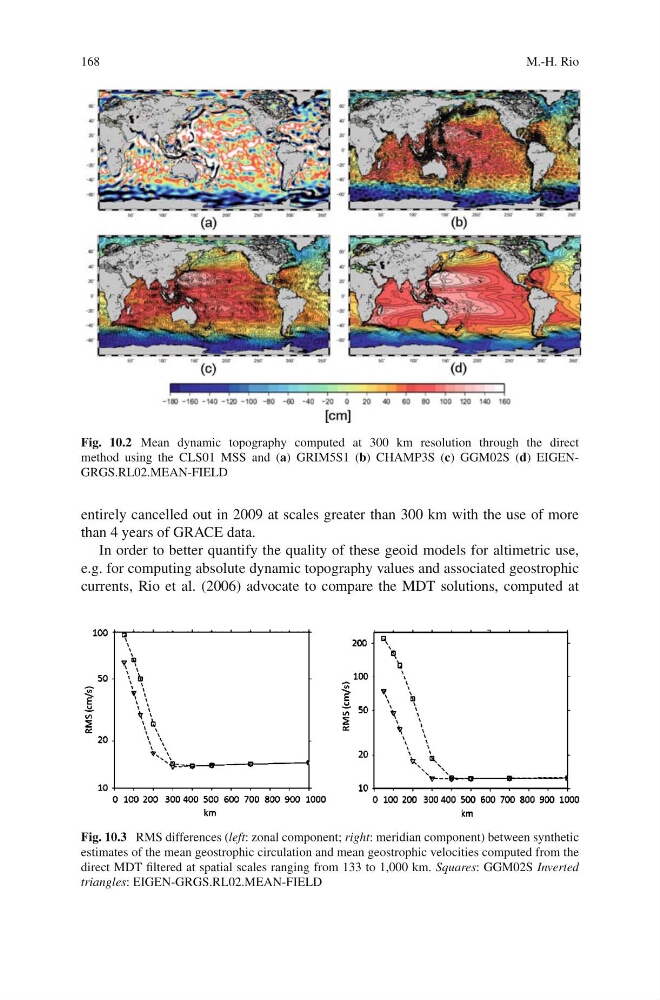
In order to better quantify the quality of these geoid models for altimetric use,
e.g. for computing absolute dynamic topography values and associated geostrophic
currents, Rio et al. (2006) advocate to compare the MDT solutions, computed at
Fig. 10.3 RMS differences (left: zonal component; right: meridian component) between synthetic
estimates of the mean geostrophic circulation and mean geostrophic velocities computed from the
direct MDT filtered at spatial scales ranging from 133 to 1,000 km. Squares: GGM02S Inverted
triangles: EIGEN-GRGS.RL02.MEAN-FIELD
M.-H. Rio
Fig. 10.2 Mean dynamic topography computed at 300 km resolution through the direct
method using the CLS01 MSS and (a) GRIM5S1 (b) CHAMP3S (c) GGM02S (d) EIGENGRGS.RL02.MEAN-FIELD
entirely cancelled out in 2009 at scales greater than 300 km with the use of more
than 4 years of GRACE data.
In order to better quantify the quality of these geoid models for altimetric use,
e.g. for computing absolute dynamic topography values and associated geostrophic
currents, Rio et al. (2006) advocate to compare the MDT solutions, computed at
Fig. 10.3 RMS differences (left: zonal component; right: meridian component) between synthetic
estimates of the mean geostrophic circulation and mean geostrophic velocities computed from the
direct MDT filtered at spatial scales ranging from 133 to 1,000 km. Squares: GGM02S Inverted
triangles: EIGEN-GRGS.RL02.MEAN-FIELD