

156
L.-L. Fu
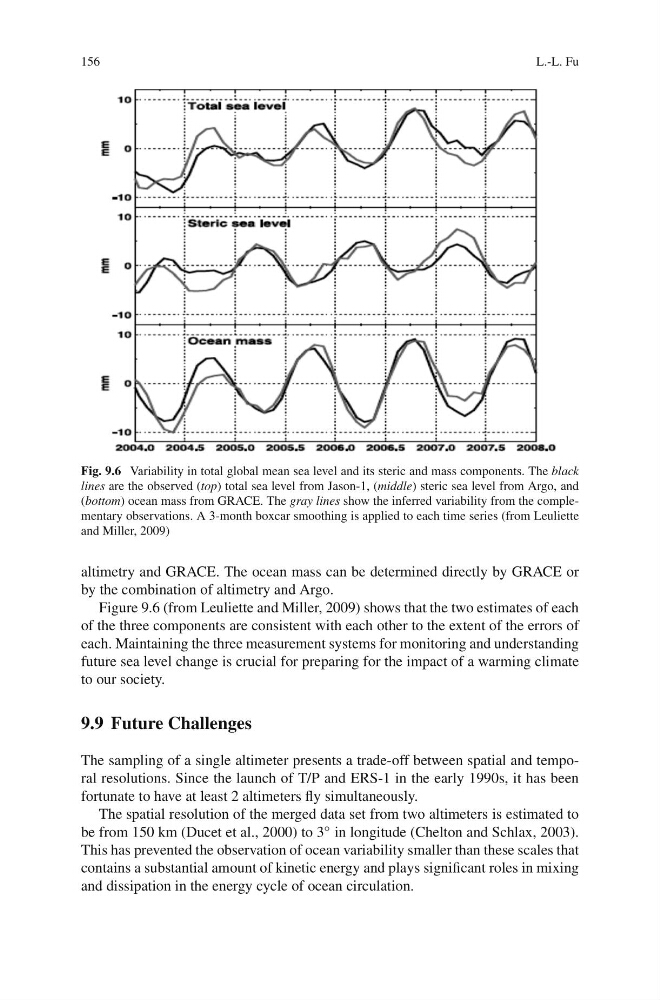
Fig. 9.6 Variability in total global mean sea level and its steric and mass components. The black
lines are the observed (top) total sea level from Jason-1, (middle) steric sea level from Argo, and
(bottom) ocean mass from GRACE. The gray lines show the inferred variability from the complementary observations. A 3-month boxcar smoothing is applied to each time series (from Leuliette
and Miller, 2009)
altimetry and GRACE. The ocean mass can be determined directly by GRACE or
by the combination of altimetry and Argo.
Figure 9.6 (from Leuliette and Miller, 2009) shows that the two estimates of each
of the three components are consistent with each other to the extent of the errors of
each. Maintaining the three measurement systems for monitoring and understanding
future sea level change is crucial for preparing for the impact of a warming climate
to our society.
9.9 Future Challenges
The sampling of a single altimeter presents a trade-off between spatial and temporal resolutions. Since the launch of T/P and ERS-1 in the early 1990s, it has been
fortunate to have at least 2 altimeters fly simultaneously.
The spatial resolution of the merged data set from two altimeters is estimated to
be from 150 km (Ducet et al., 2000) to 3 ◦ in longitude (Chelton and Schlax, 2003).
This has prevented the observation of ocean variability smaller than these scales that
contains a substantial amount of kinetic energy and plays significant roles in mixing
and dissipation in the energy cycle of ocean circulation.
L.-L. Fu
Fig. 9.6 Variability in total global mean sea level and its steric and mass components. The black
lines are the observed (top) total sea level from Jason-1, (middle) steric sea level from Argo, and
(bottom) ocean mass from GRACE. The gray lines show the inferred variability from the complementary observations. A 3-month boxcar smoothing is applied to each time series (from Leuliette
and Miller, 2009)
altimetry and GRACE. The ocean mass can be determined directly by GRACE or
by the combination of altimetry and Argo.
Figure 9.6 (from Leuliette and Miller, 2009) shows that the two estimates of each
of the three components are consistent with each other to the extent of the errors of
each. Maintaining the three measurement systems for monitoring and understanding
future sea level change is crucial for preparing for the impact of a warming climate
to our society.
9.9 Future Challenges
The sampling of a single altimeter presents a trade-off between spatial and temporal resolutions. Since the launch of T/P and ERS-1 in the early 1990s, it has been
fortunate to have at least 2 altimeters fly simultaneously.
The spatial resolution of the merged data set from two altimeters is estimated to
be from 150 km (Ducet et al., 2000) to 3 ◦ in longitude (Chelton and Schlax, 2003).
This has prevented the observation of ocean variability smaller than these scales that
contains a substantial amount of kinetic energy and plays significant roles in mixing
and dissipation in the energy cycle of ocean circulation.