

9 Determining Ocean Circulation and Sea Level from Satellite Altimetry
155
precision altimetry. Although T/P and its follow-ons were not designed for meeting performance requirement at this level, through a dedicated effort of a large
team of scientists and engineers, it has been demonstrated that the measurement
accuracy has reached sub mm/year level (Ablain et al., 2009). The record of altimetry data from T/P and its follow-ons, supplemented by data from other missions,
has provided the foundation for the determination of present-day sea level change
(Cazenave and Nerem, 2004). The global coverage of altimetry observation has
provided not only a mean value of the sea level rise, estimated at a rate of 3.4
± 0.6 mm/year, from 1993 to 2008 (Ablain et al., 2009), but also a map of the
geographical pattern of sea level change.
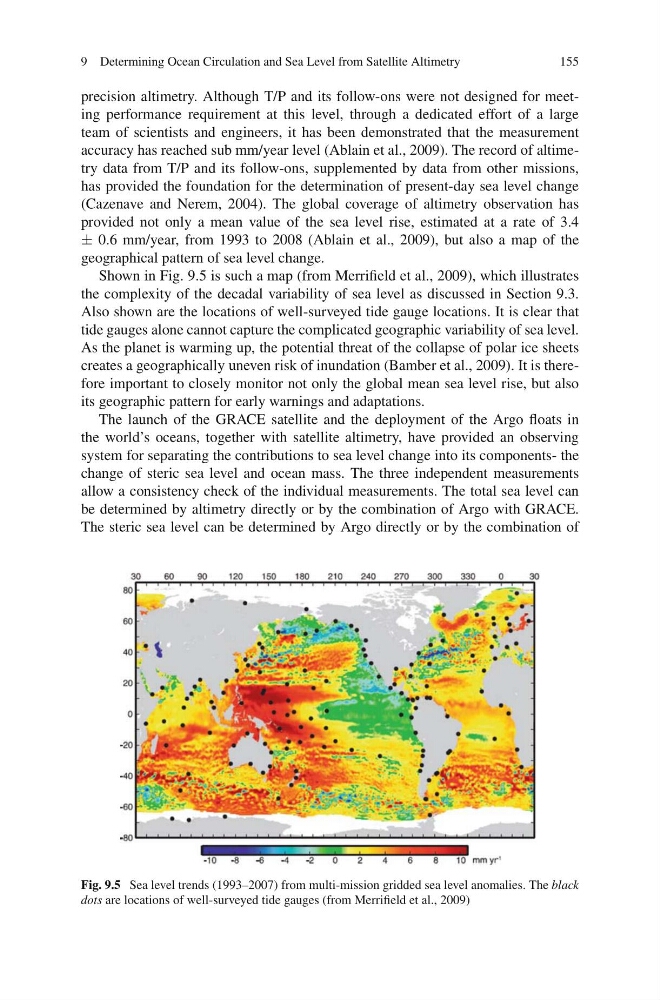
Shown in Fig. 9.5 is such a map (from Merrifield et al., 2009), which illustrates
the complexity of the decadal variability of sea level as discussed in Section 9.3.
Also shown are the locations of well-surveyed tide gauge locations. It is clear that
tide gauges alone cannot capture the complicated geographic variability of sea level.
As the planet is warming up, the potential threat of the collapse of polar ice sheets
creates a geographically uneven risk of inundation (Bamber et al., 2009). It is therefore important to closely monitor not only the global mean sea level rise, but also
its geographic pattern for early warnings and adaptations.
The launch of the GRACE satellite and the deployment of the Argo floats in
the world’s oceans, together with satellite altimetry, have provided an observing
system for separating the contributions to sea level change into its components- the
change of steric sea level and ocean mass. The three independent measurements
allow a consistency check of the individual measurements. The total sea level can
be determined by altimetry directly or by the combination of Argo with GRACE.
The steric sea level can be determined by Argo directly or by the combination of
Fig. 9.5 Sea level trends (1993–2007) from multi-mission gridded sea level anomalies. The black
dots are locations of well-surveyed tide gauges (from Merrifield et al., 2009)
155
precision altimetry. Although T/P and its follow-ons were not designed for meeting performance requirement at this level, through a dedicated effort of a large
team of scientists and engineers, it has been demonstrated that the measurement
accuracy has reached sub mm/year level (Ablain et al., 2009). The record of altimetry data from T/P and its follow-ons, supplemented by data from other missions,
has provided the foundation for the determination of present-day sea level change
(Cazenave and Nerem, 2004). The global coverage of altimetry observation has
provided not only a mean value of the sea level rise, estimated at a rate of 3.4
± 0.6 mm/year, from 1993 to 2008 (Ablain et al., 2009), but also a map of the
geographical pattern of sea level change.
Shown in Fig. 9.5 is such a map (from Merrifield et al., 2009), which illustrates
the complexity of the decadal variability of sea level as discussed in Section 9.3.
Also shown are the locations of well-surveyed tide gauge locations. It is clear that
tide gauges alone cannot capture the complicated geographic variability of sea level.
As the planet is warming up, the potential threat of the collapse of polar ice sheets
creates a geographically uneven risk of inundation (Bamber et al., 2009). It is therefore important to closely monitor not only the global mean sea level rise, but also
its geographic pattern for early warnings and adaptations.
The launch of the GRACE satellite and the deployment of the Argo floats in
the world’s oceans, together with satellite altimetry, have provided an observing
system for separating the contributions to sea level change into its components- the
change of steric sea level and ocean mass. The three independent measurements
allow a consistency check of the individual measurements. The total sea level can
be determined by altimetry directly or by the combination of Argo with GRACE.
The steric sea level can be determined by Argo directly or by the combination of
Fig. 9.5 Sea level trends (1993–2007) from multi-mission gridded sea level anomalies. The black
dots are locations of well-surveyed tide gauges (from Merrifield et al., 2009)